FIGURE 4.

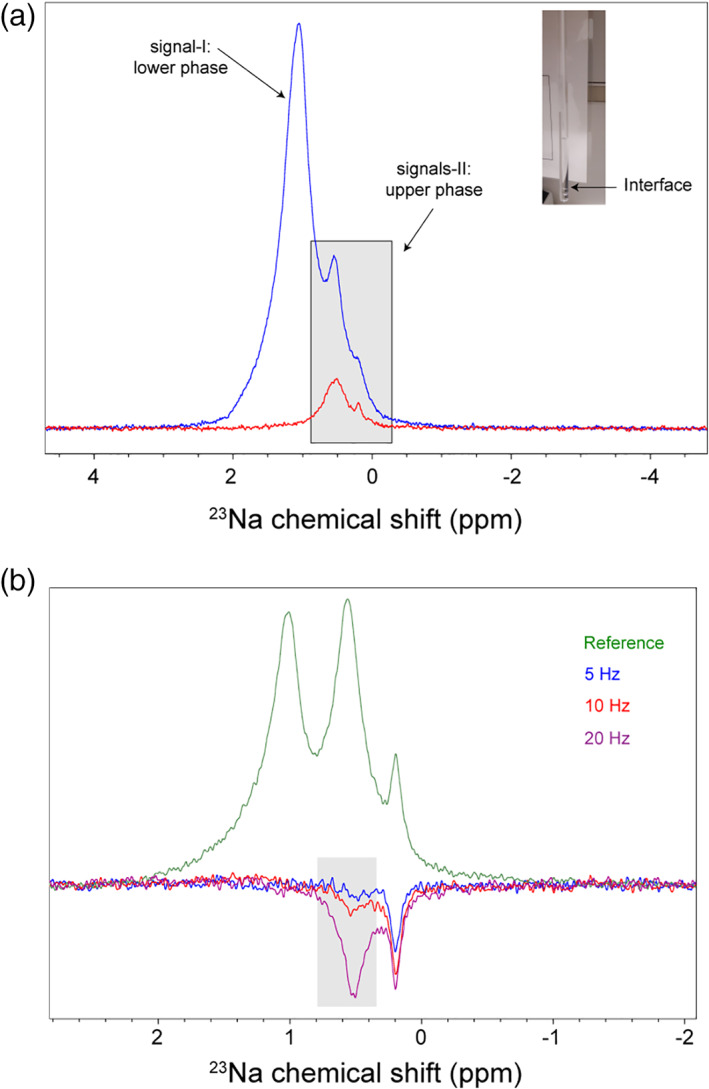
Phase separation in water‐triethylamine (5%/95% vol/vol) mixture, studied by 23NaCl NMR. (a) The mixture undergoes a rapid phase separation to an upper triethylamine‐rich phase and a lower (relatively) water‐rich phase separated by the “Interface.” 1D 23Na NMR spectrum of the whole sample encompassing both phases (blue) is superimposed with the spectrum of only the upper phase (red), showing that the leftmost signal is originated from the lower phase, while the two rightmost signals are from the upper phase. (b) 1D difference spectra with selective saturation of the resonance at 0.19 ppm revealed saturation transfer to the resonance at 0.53 ppm, that increased in dependence of the irradiation strength. The selective saturation of the resonance at 0.19 ppm was achieved using continuous‐wave (cw) irradiation at the strengths of 5 (blue), 10 (red) or 20 Hz (purple). The reference spectrum was obtained with irradiation frequency set far off‐resonance (50 ppm)
