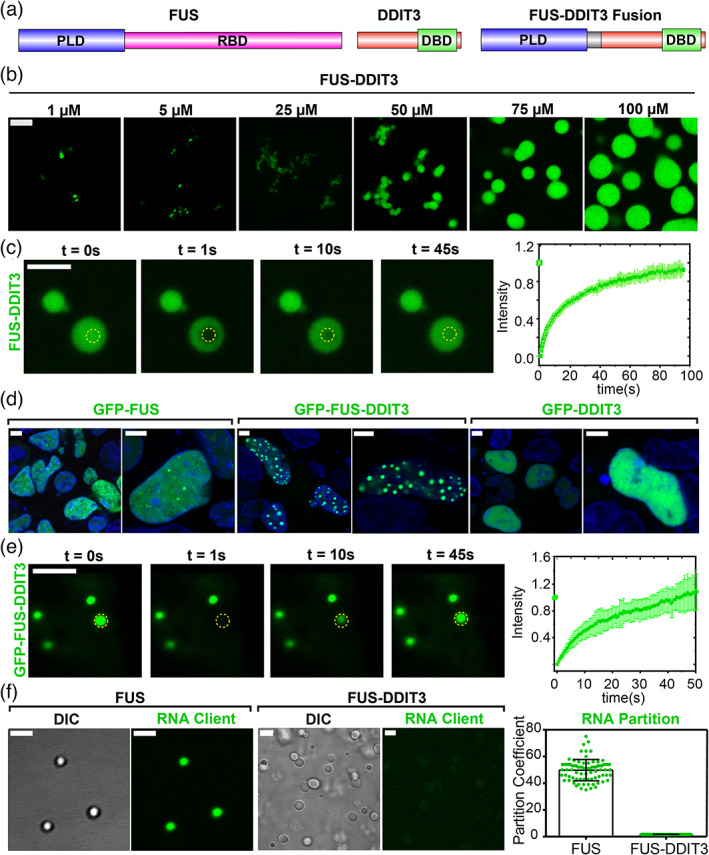
FIGURE 1.

Oncofusion protein FUS‐DDIT3 undergoes liquid–liquid phase separation in vitro and in mammalian cells. (a) Schematics of FUS, DDIT3, and FUS‐DDIT3 domain architectures. DBD, DNA‐binding domain; PLD, prion‐like domain; RBD, RNA‐binding domain. (b) Fluorescence microscopy images of the assemblies formed by recombinantly purified FUS‐DDIT3 (mixed with 250 nM AlexaFluor488‐labeled FUS‐DDIT3) at varying protein concentrations. (c) Representative fluorescence recovery after photobleaching (FRAP) images of recombinant FUS‐DDIT3 condensates at 50 μM (t = 0 s: pre‐bleach; t = 1 s: bleach; t > 1 s: recovery). Right: The FRAP curve shows the average intensity and standard deviation of the intensity profiles over time (n = 3). (d) Fluorescence microscopy images of HEK293T cells expressing GFP‐tagged proteins (FUS, FUS‐DDIT3, or DDIT3), as indicated. Hoechst was used to stain the nucleus and is shown in blue. (e) Representative FRAP images of GFP‐FUS‐DDIT3 condensates expressed in HEK293T cells (t = 0 s: pre‐bleach; t = 1 s: bleach; t > 1 s: recovery). Right: The FRAP curve shows the average intensity and standard deviation of the intensity profiles over time (n = 3). (f) Partitioning of FAM‐labeled RNA client into condensates of recombinant FUS‐DDIT3 (50 μM) and recombinant FUS (6 μM). DIC, differential interference contrast; FAM, 6‐Carboxyfluorescein. Right: Enrichment is calculated as partition coefficients. Mean and standard deviation are shown. The scale bar is 5 μm for all images
