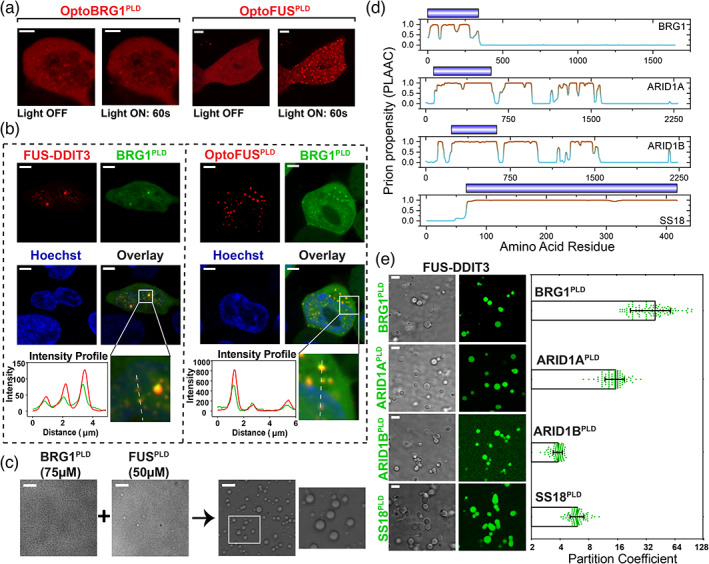
FIGURE 3.

Many mSWI/SNF complex subunits contain PLDs and enrich into FUS‐DDIT3 condensates via heterotypic PLD‐PLD interactions. (a) HEK293T cells expressing OptoBRG1PLD (left) or OptoFUSPLD (right) before and after activation with blue light for 60 sec. Scale bar is 5 μm. (b) HEK293T cells co‐expressing GFP‐BRG1PLD and either Cry2‐mCherry‐FUS‐DDIT3 (left) or OptoFUSPLD (right). OptoFUSPLD droplets were formed by blue light stimulation for 60 sec and then enrichment of GFP‐BRG1PLD was analyzed within the condensates. Cry2‐mCherry‐FUS‐DDIT3 condensates were spontaneously formed via protein overexpression (see Figure S3 middle panel for additional data on mCherry‐FUS‐DDIT3 condensates without the Cry2 domain). Hoechst (blue) was used to stain the nucleus. The region demarcated in the white square is magnified and the fluorescence intensity profile is shown across the linear section (white line). Green represents the intensity profile of GFP‐BRG1PLD and red represents the profile for either Cry2‐mCherry‐FUS‐DDIT3 or OptoFUSPLD. The scale bar is 5 μm. (c) Co‐condensation of purified BRG1PLD and FUSPLD. The region demarcated in the white square is magnified and shown for better clarity. The scale bar is 10 μm. (d) PLAAC analysis showing multiple regions with high prion‐propensity for the four selected subunits of mSWI/SNF complex (see Figure S5 for PLAAC profiles for all PLD‐containing mSWI/SNF complex subunits). Domains corresponding to royal blue bars were recombinantly expressed and purified and used in our experiments (panel e). (e) Partitioning of recombinant PLDs from panel d (fluorescently‐labeled with AlexaFluor488) into FUS‐DDIT3 condensates (50 μM). Enrichment is calculated as partition coefficient. Mean and standard deviation are shown. (Partition coefficients: BRG1PLD = 40 ± 20; ARID1APLD = 15 ± 4; ARID1BPLD = 3.8 ± 0.4; SS18PLD = 6 ± 1). The scale bar is 10 μm
