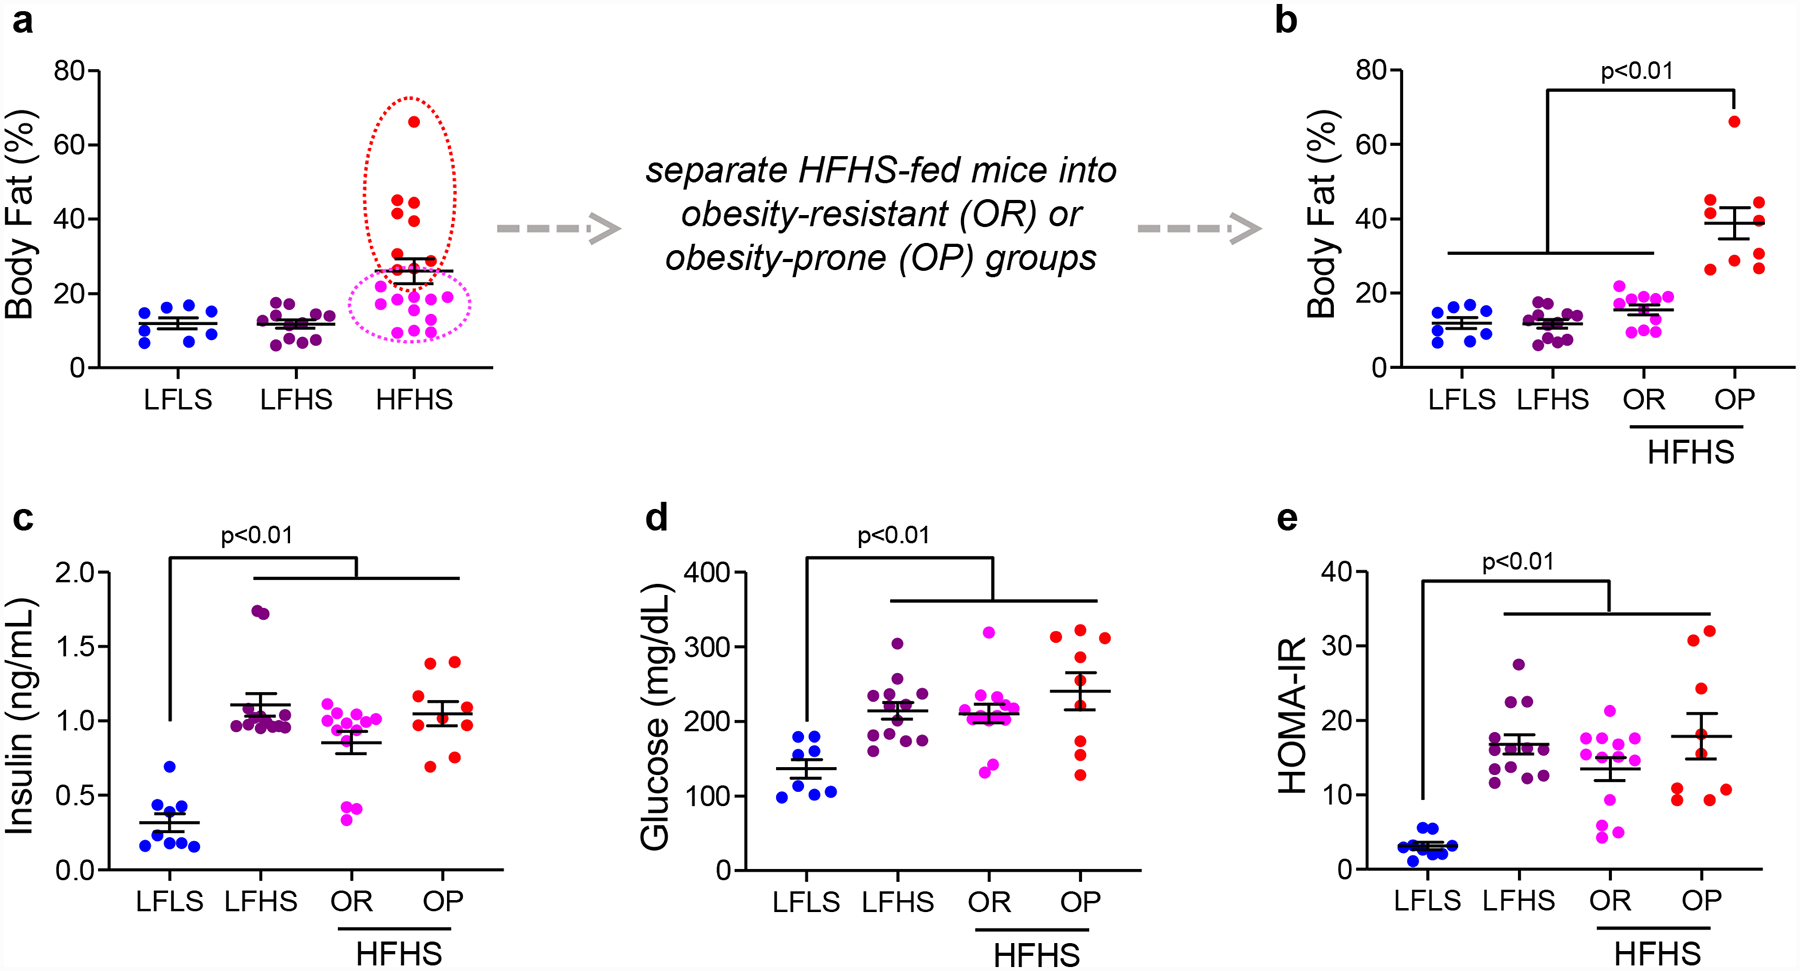
Figure 2. Diet-induced separation of obesity and metabolic dysfunction in mice.

(A) Body fat percentage measured by qMR in Rag1-null C57Bl/6 mice fed low-fat/low-sucrose (LFLS), low-fat/high-sucrose (LFHS), or high-fat/high-sucrose (HFHS) diets. Note the variability in body fat across the HFHS group. (B) Body fat percentage in LFLS, LFHS, and HFHS fed mice, showing the obesity resistant (OR) and obesity prone (OP) groups separately. (C) Fasting insulin and (D) glucose measured in mice on LFLS, LFHS, or HFHS diets. (E) HOMA-IR calculated from fasting insulin and glucose measures in mice on LFLS, LFHS, or HFHS diets. Bars represent mean and SEM. Data were analyzed by unpaired t-test.
