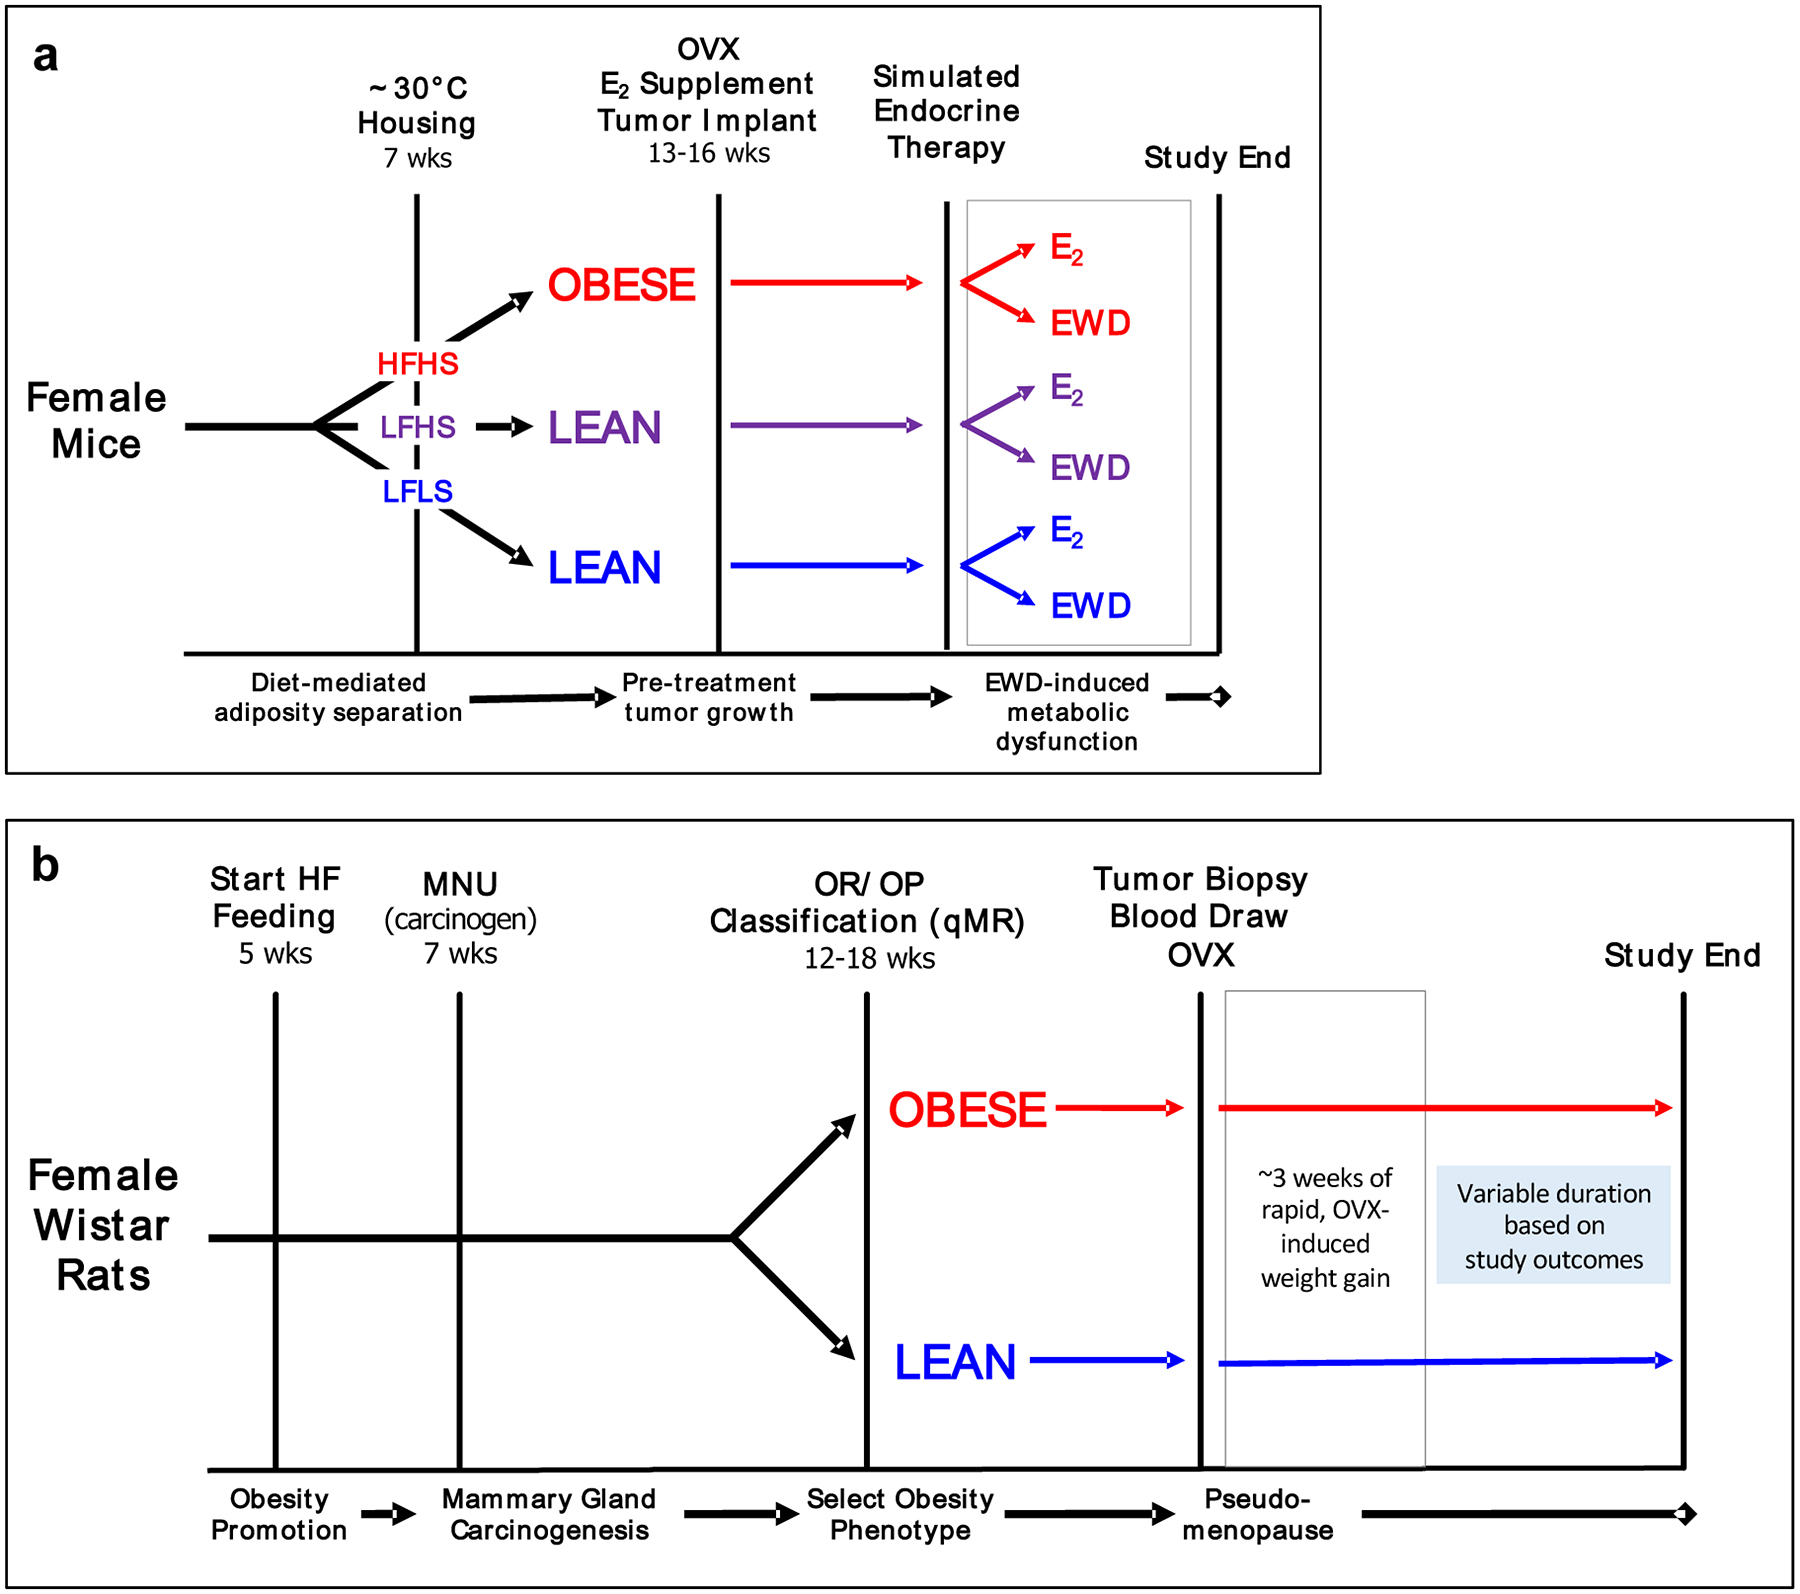
Figure 7. General Overview of Models.

Key features of studies done in (A) mice and (B) rats are shown. The grey box in each diagram represents the period following estrogen loss when weight gain and insulin resistance increase. OVX-ovariectomy; EWD-estrogen withdrawal; LFLS-low fat/low sucrose; LFHS-low fat/high sucrose; HFHS-high fat/high sucrose.
