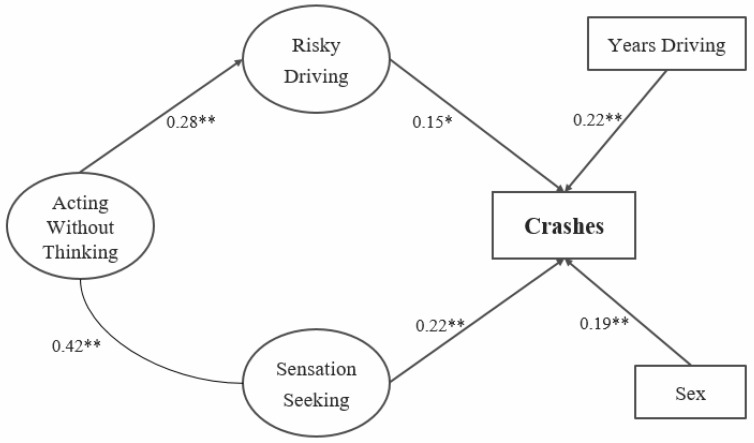
Figure 1.
Path diagram for Crash Model 2 illustrating the association between risky driving (including cell phone use), sensation seeking, and crashes. Note: straight lines indicate direct regression paths, with standardized beta values in the SEM model. The curved connector indicates the standardized estimate of correlation between variables. * indicates significance at the p < 0.05 significance level, with ** representing significance at the p < 0.01 level.

