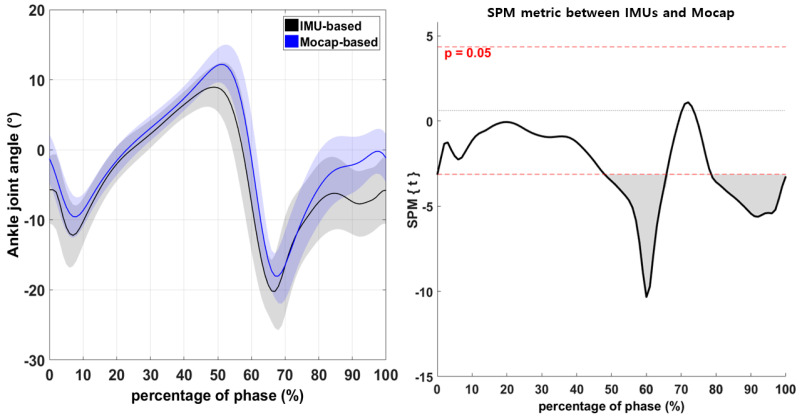
Figure 5.
Comparison of the ankle-joint angle between the IMU-based and Mocap systems according to one-dimensional SPM. Horizontal dashed lines illustrate significant differences at α = 0.05, and the result is visualized as a waveform (the gray area in the figure on the right indicates significant differences).

