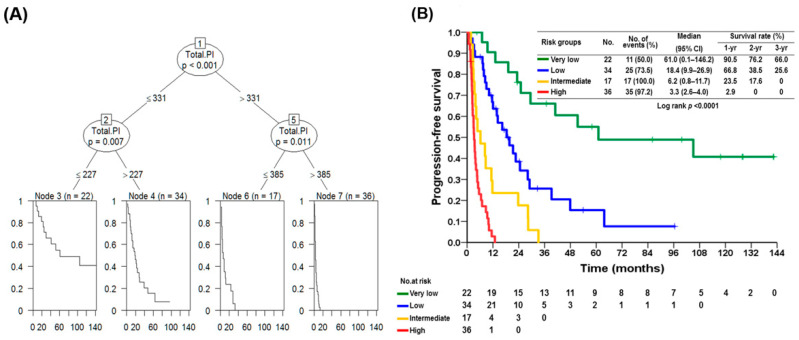
Figure 3.
Survival analysis tree and Kaplan–Meier plot by nomogram points. (A) A survival analysis tree was used and to establish an optimal cut-off point to better predict the recurrence. (B) Kaplan–Meier plot of the PFS of 109 patients with advanced GISTs treated with sunitinib in terms of risk with different scores.

