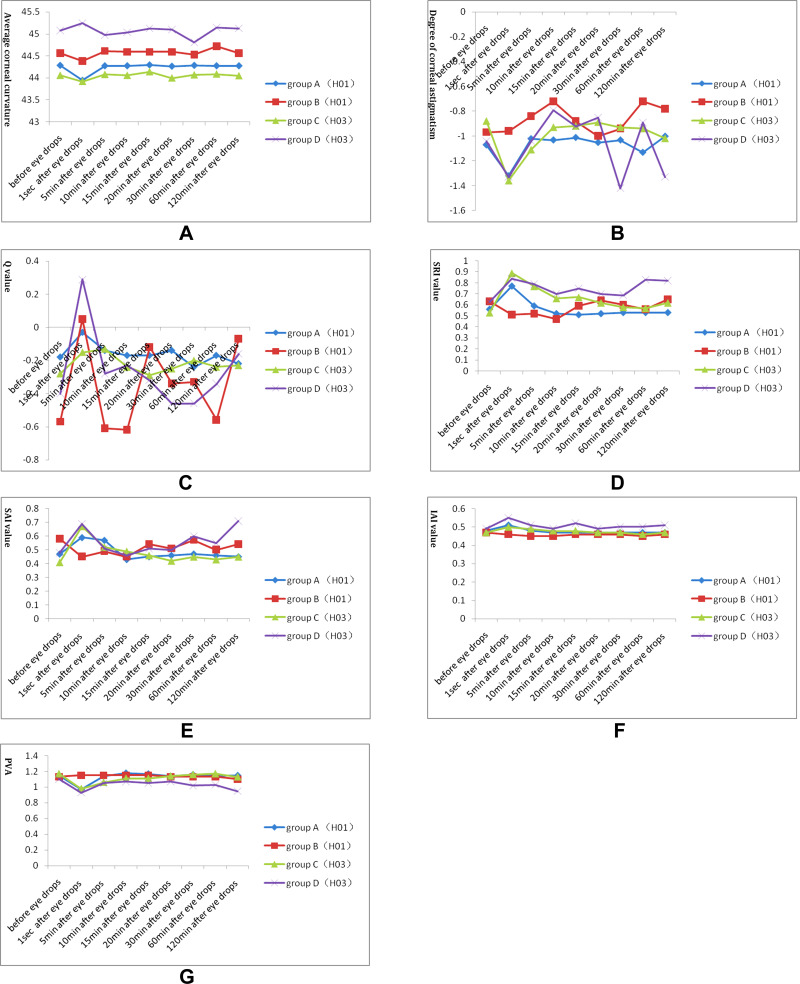
Figure 1.
Changes of the indices before and after treatment in groups A, B, C, and D. Horizontal axis: before treatment, 1 sec, 5 min, 10 min, 15 min, 20 min, 30 min, 60 min, and 120 min after treatment. Longitudinal axis: average corneal curvature (A), degree of corneal astigmatism (B), Q value (C), SRI value (D), SAI value (E), IAI value (F), and PVA (G).

