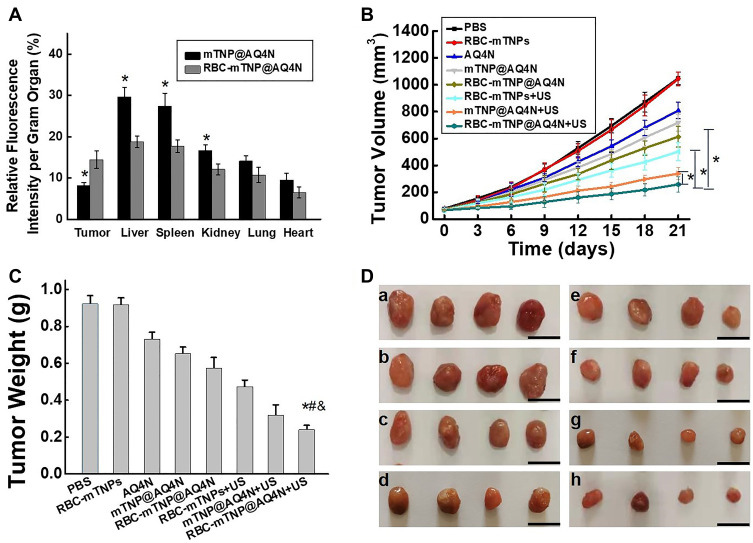
Figure 4.
In vivo therapeutic effect. (A) Biodistribution of cy5.5-labeled RBC-mTNP@AQ4N at 24 h of intravenous post-injection. *P < 0.05 vs the RBC-mTNP@AQ4N. (B) Tumor growth curves. (C) Tumor weight. *P < 0.05 vs the RBC-mTNP + US; #P < 0.05 vs the RBC-mTNP@AQ4N; &P < 0.05 vs the mTNP@AQ4N. (D) Tumor photographs.
Notes: a) Control group; b) RBC-TNPs; c) AQ4N; d) mTNP@AQ4N; e) RBC-mTNP@AQ4N; f) RBC-mTNPs+US; g) mTNP@AQ4N+US; h) RBC-TNP@AQ4N+US, scale bar=1 cm. All the data represent mean ± S.D. (n=4).

