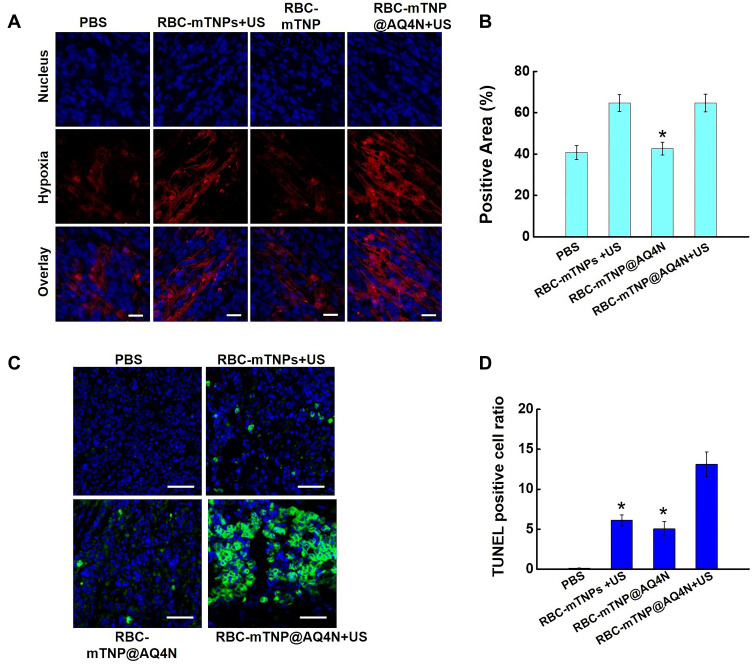
Figure 5.
Hypoxic and apoptotic status in tumor tissues. (A) Immunofluorescence images of tumor sections stained with antipimonidazole antibody after various treatments, scale bar=100 μm. (B) Flow cytometry analysis of hypoxia positive areas. *p < 0.05 versus RBC-mTNP@AQ4N. All the data represent mean ± S.D. (n=4). (C) Fluorescence images of the TUNEL staining of the tumor sections after various treatments. The blue fluorescence shows the location of the nucleus, and the green fluorescence shows the location of the apoptotic cells; scale bar=100 μm. (D) Flow cytometry analysis of tumor apoptotic rate. *p < 0.05 versus RBC-mTNP@AQ4N+US. All the data represent mean ± S.D. (n=4).

