
FIGURE 5.
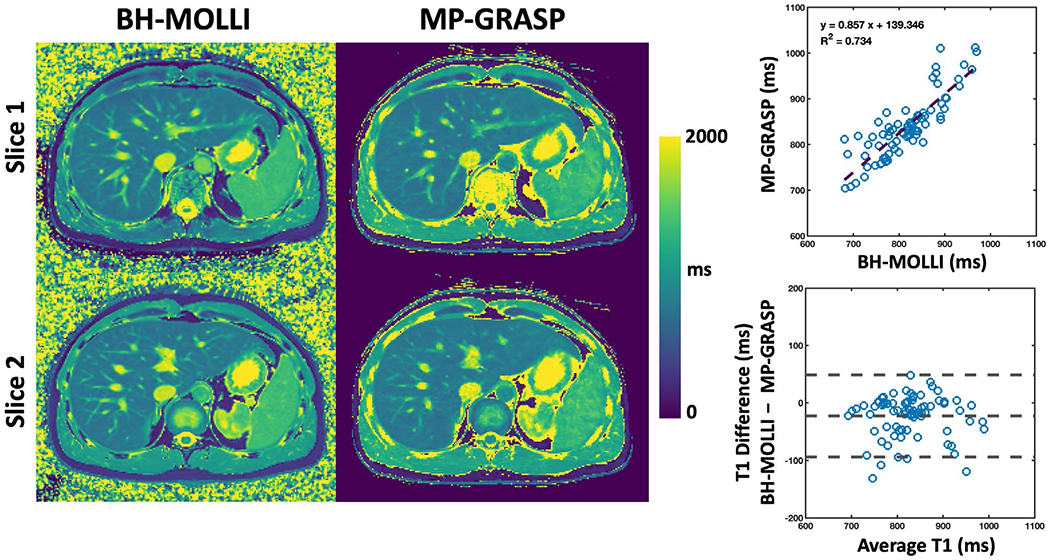
Comparison of liver T1 maps from BH-MOLLI and MP-GRASP for two different slices from one volunteer. The T1 maps are visually comparable and the linear regression plot indicates moderate T1 correlation (R2 = 0.734). T1 values estimated from BH-MOLLI are lower compared to those from MP-GRASP based on the Bland-Altman plot