
Figure 4.
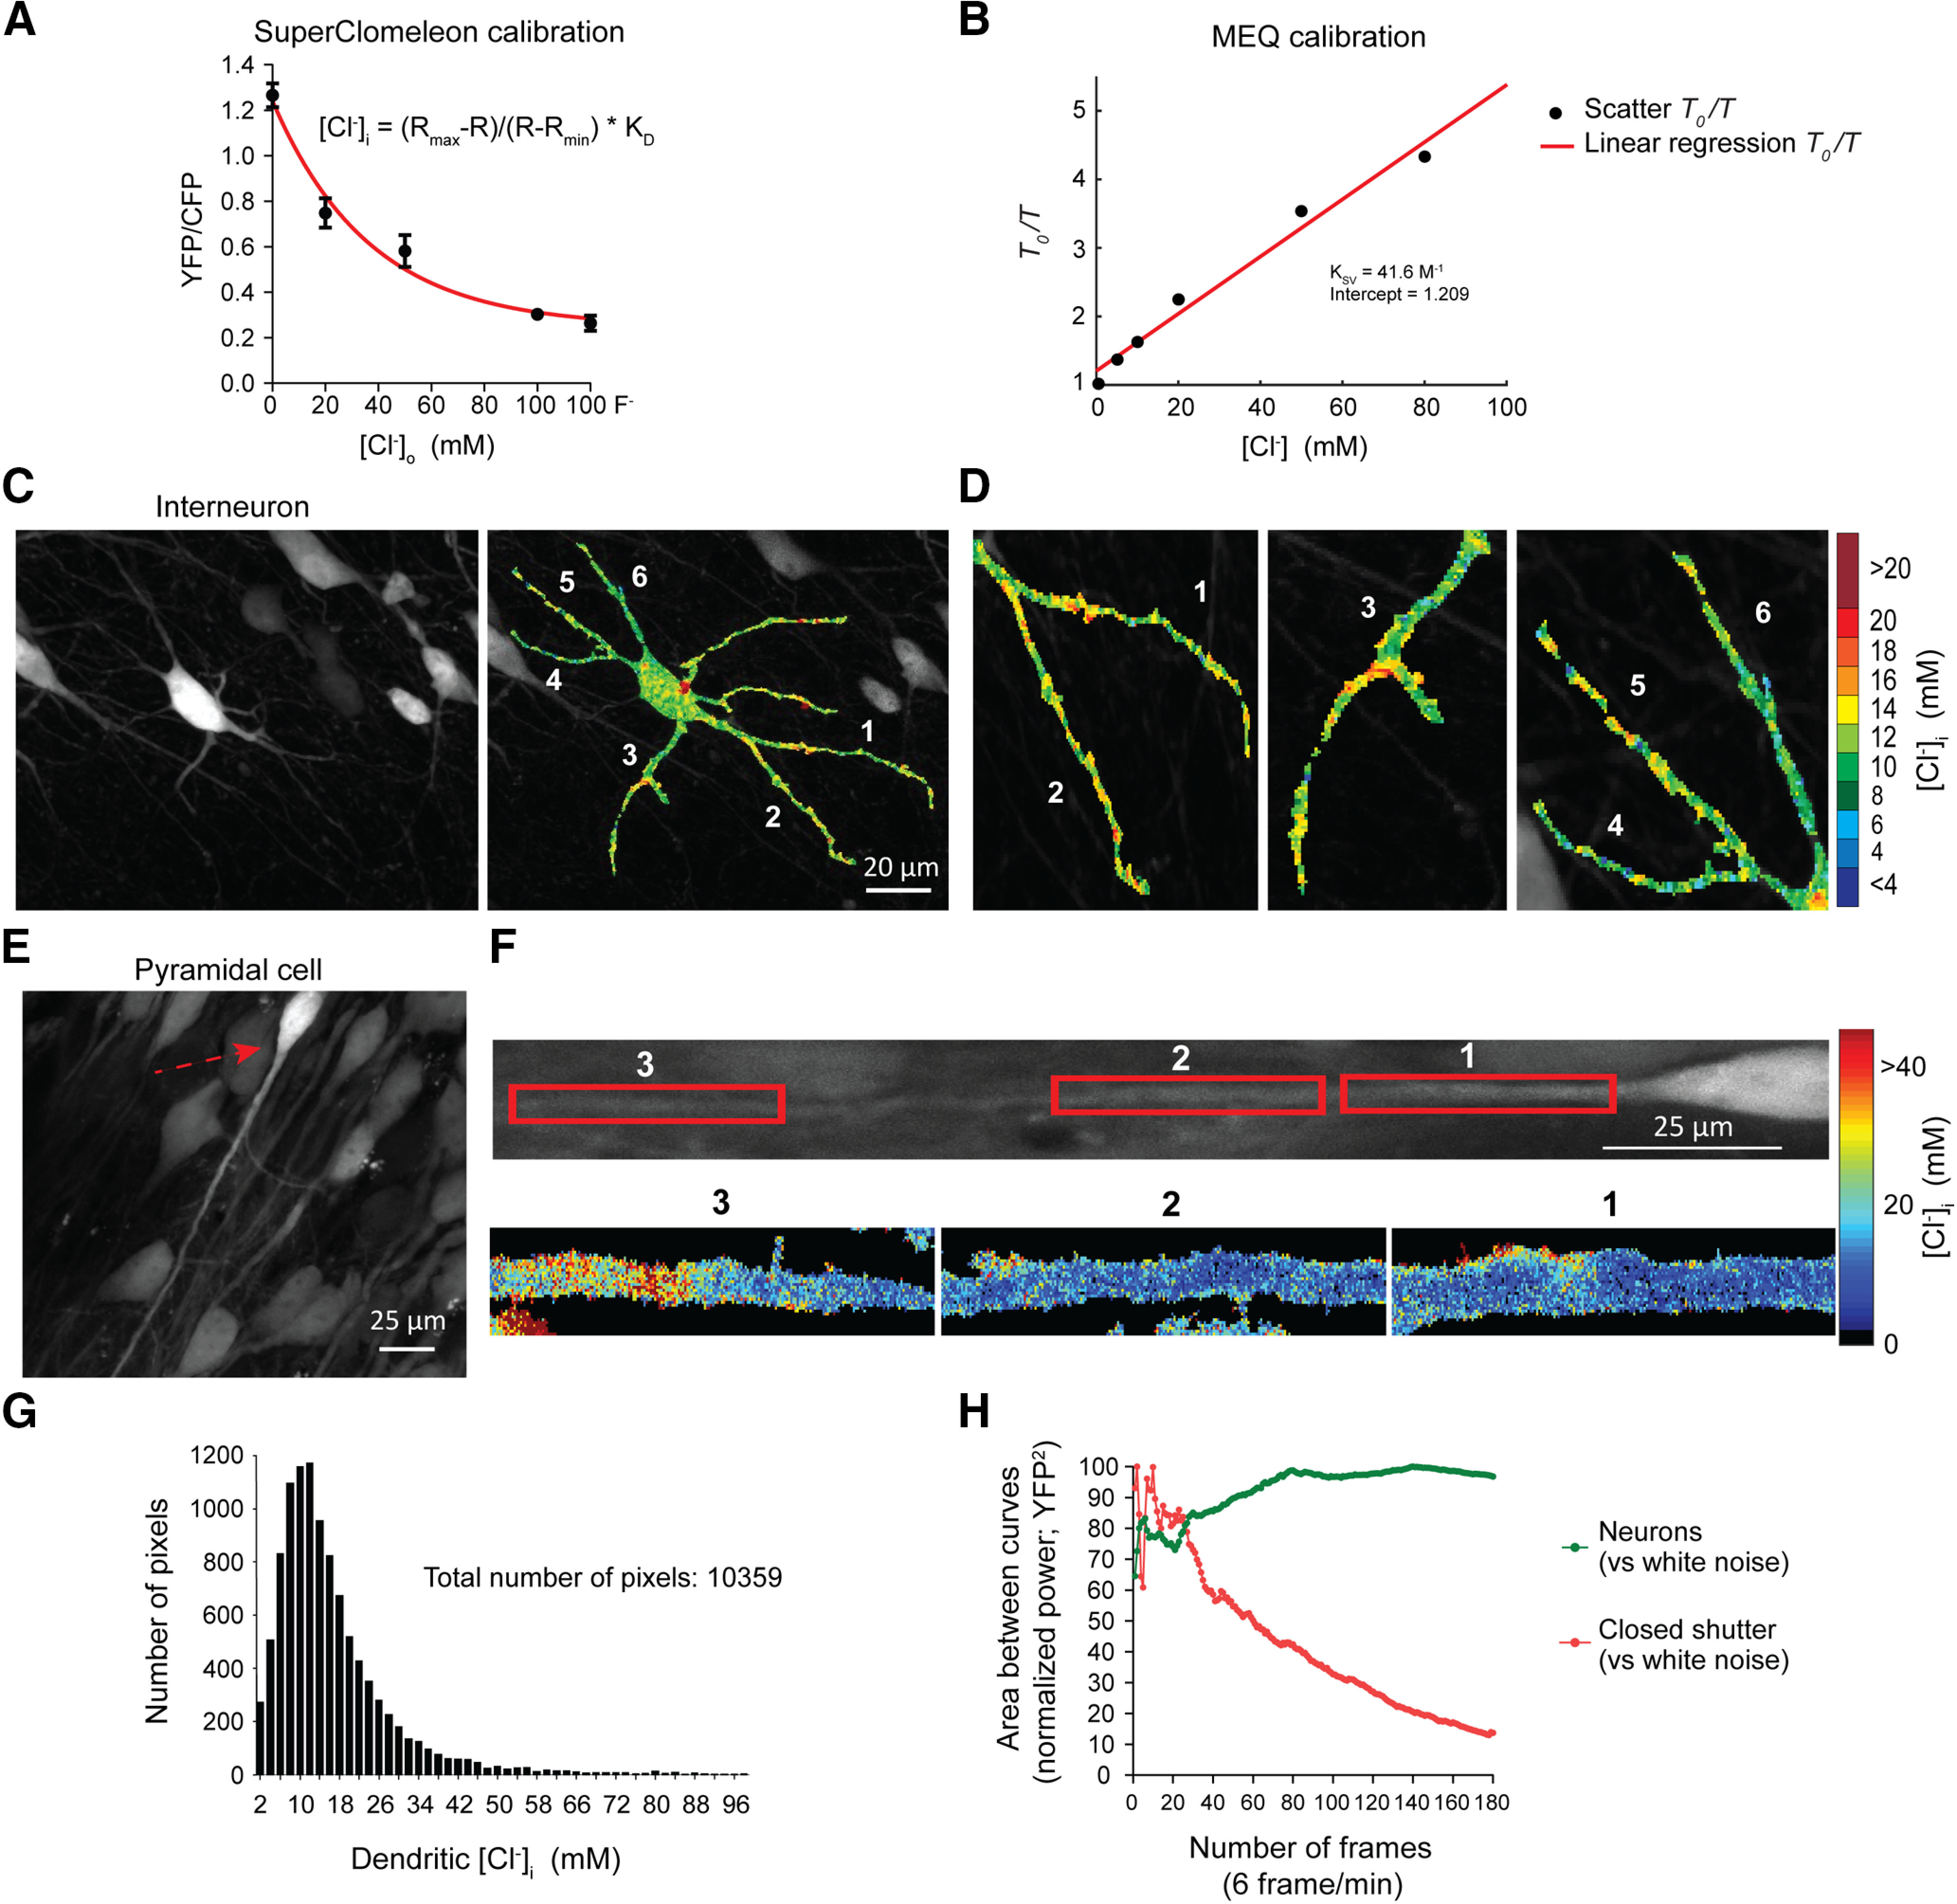
Evidence for the existence of chloride microdomains from in vitro sCLM imaging. A, sCLM was calibrated in organotypic slice cultures at different concentrations of Cl– and in the presence of 50 µm of nigericin and 100 µm of tributyltin. With single-cell resolution, we calculated Rmax, Rmin, and Kd as described in Materials and Methods. Only neurons that responded to different Cl– concentrations in extracellular media ([Cl–]o) were selected for final calculations. The range of values for Rmax measured by two-photon microscopy in different calibration experiments was between 1.240 and 1.777. Rmin ranged between 0.289 and 0.466. Kd was between 22.31 and 22.99 mm. For DualView imaging, Rmax and Rmin were 1.640 and 0.984 respectively. B, MEQ was calibrated using Stern–Volmer equation. MEQ was dissolved in the same solution as the internal pipette solution (K-MeSO4-based) with different concentrations of Cl–. C, D, Two-photon imaging of an organotypic slice culture showing a hippocampal interneuron (C) and the dendritic variations in [Cl–]i (D). E, A CA1 pyramidal cell from a hippocampal organotypic slice-expressing sCLM. F, Top, The rotated neuron in E with a red arrow. Bottom, The magnified pseudocolored [Cl–]i maps of different segments of the dendrite. G, Histogram of all pixels derived from the dendrite of the neuron depicted in F. H, CLM-expressing neurons were imaged for 30 min (180 frames at 6 frames/min). The deviation from a white noise power spectrum is plotted against the number of time frames for the mean power spectra of both the neuronal YFP signal and closed-shutter noise. The resulting normalized curves converge toward significantly different values and demonstrate a decreased time variance of the spatial distribution of the YFP signal versus normalized closed-shutter noise.