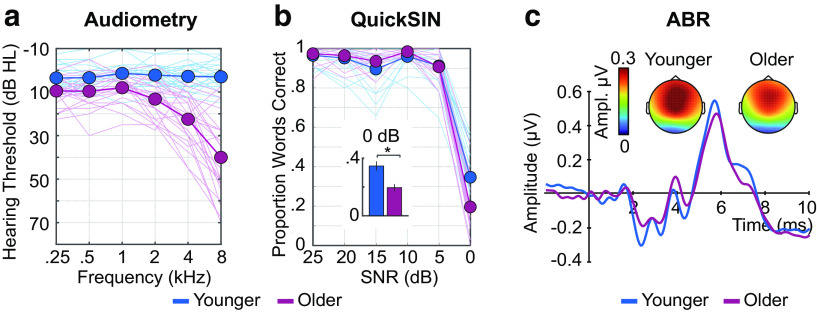
Figure 3.
Hearing assessment measures. (a) Audiometric thresholds, (b) QuickSIN performance, and (c) ABRs are plotted for each age group (younger, older). Topographies represent the mean Wave V response. Thin lines in (a) and (b) reflect individual participants. Thick lines indicate the average across participants. Error bars indicate SE. *p < 0.05.

