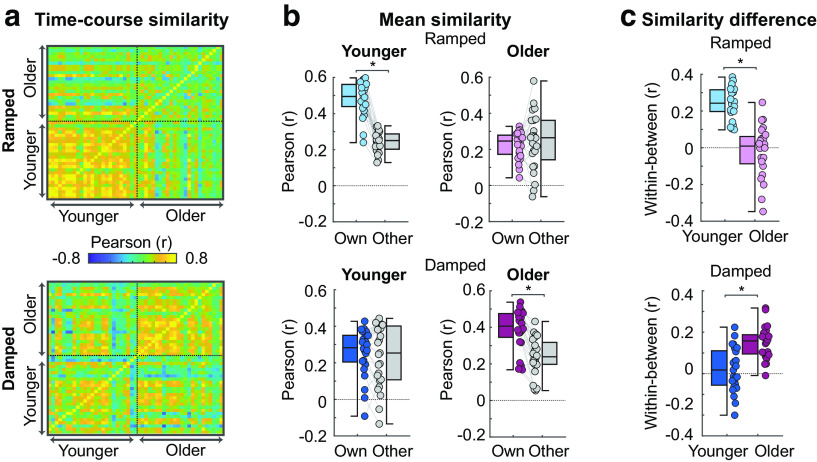
Figure 5.
Results from the time course correlation analysis. (a) Time course similarity values (r) are plotted for ramped (top panel) and damped sounds (bottom panel). Each row contains r values representing an individual's correlation between their own time course and the time course of every other individual in their own age group and other age group. (b) Mean similarity scores for ramped (top panels) and damped (bottom panels) are plotted for younger (left panels) and older subjects (right panels). Similarity scores are r values averaged based on group identity (own group r, other group r). (c) The difference in mean correlation (own group r minus other group r) for each individual are plotted for ramped (top panels) and damped (bottom panels) and for younger and older subjects. Colored dots represent individual data points. Error bars indicate SE. *p < 0.05.

