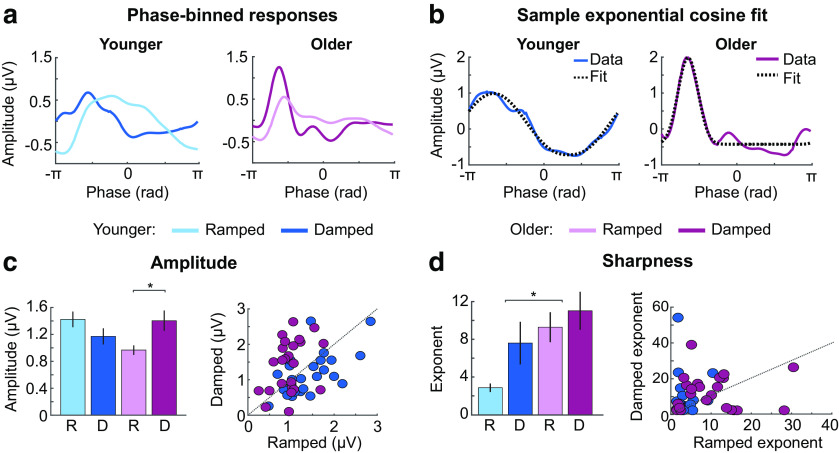
Figure 7.
Results from the signal shape analysis. (a) Mean phase-binned amplitude values are plotted as a function of phase angle (radians) for younger (left) and older participants (right) and ramped and damped envelopes shapes. (b) A phase binned amplitude exemplar (Data) for younger (left panel) and older adults (right panel) is shown along with an example of an exponential cosine fit to these data (Fit). (c) Mean amplitude values are plotted as a function of age group (younger, older) and envelope shape (ramped, damped) in the left panel. Individual data points are shown with a 45 degree reference line in the right panel. (d) Mean exponent values reflecting the sharpness of the synchronized response are plotted as a function of age group (younger, older) and envelope shape (ramped, damped) in the left panel. Individual data points are shown with a 45 degree reference line in the right panel. Error bars indicate SE. *p < 0.05.

