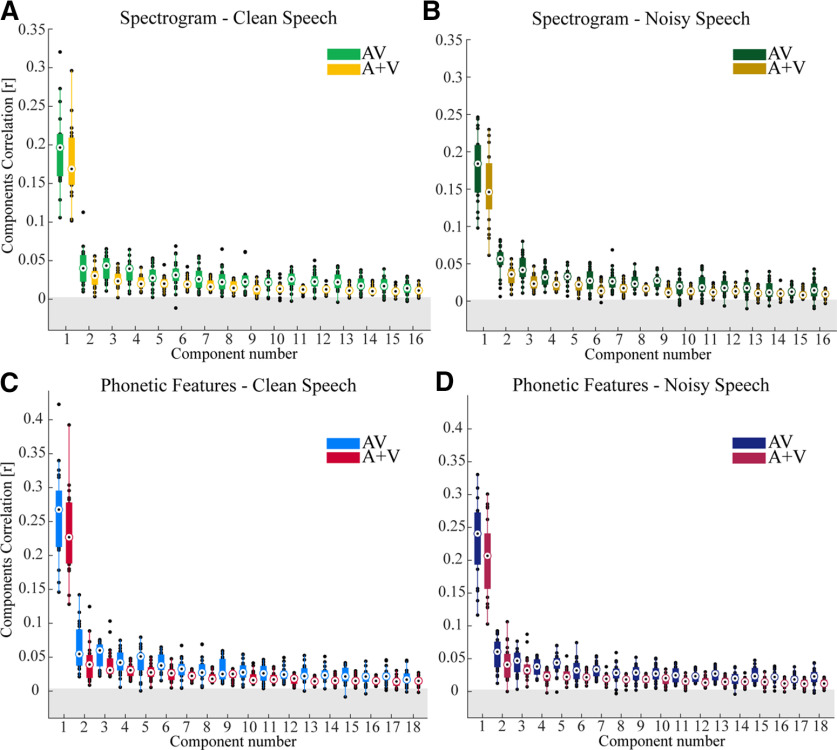
Figure 2.
CCA analysis using the spectrogram and phonetic feature representation of the speech stimulus. A, B, The canonical correlations for the spectrogram representation for speech in quiet and speech in noise, respectively. C, D, Canonical correlations for the phonetic feature representation for speech in quiet and speech in noise, respectively. The gray band represents an approximate chance level. All AV and A + V components performed above chance level p < 0.0001 for speech in quiet, and for speech in noise p < 0.0001. The boxplot function with compact format from MATLAB was used here. The edges of the boxplots display the 25th and 75th percentiles, and the median is marked by a black dot inside a white circle. A data point is determined to be an outlier if it is greater than Q75th + w x (Q75th – Q25th) or less than Q25th – w x (Q75th – Q25th), where w is the maximum whisker length and Q25th and Q75th are the 25th and 75th percentiles of the data.

