Figure 3.

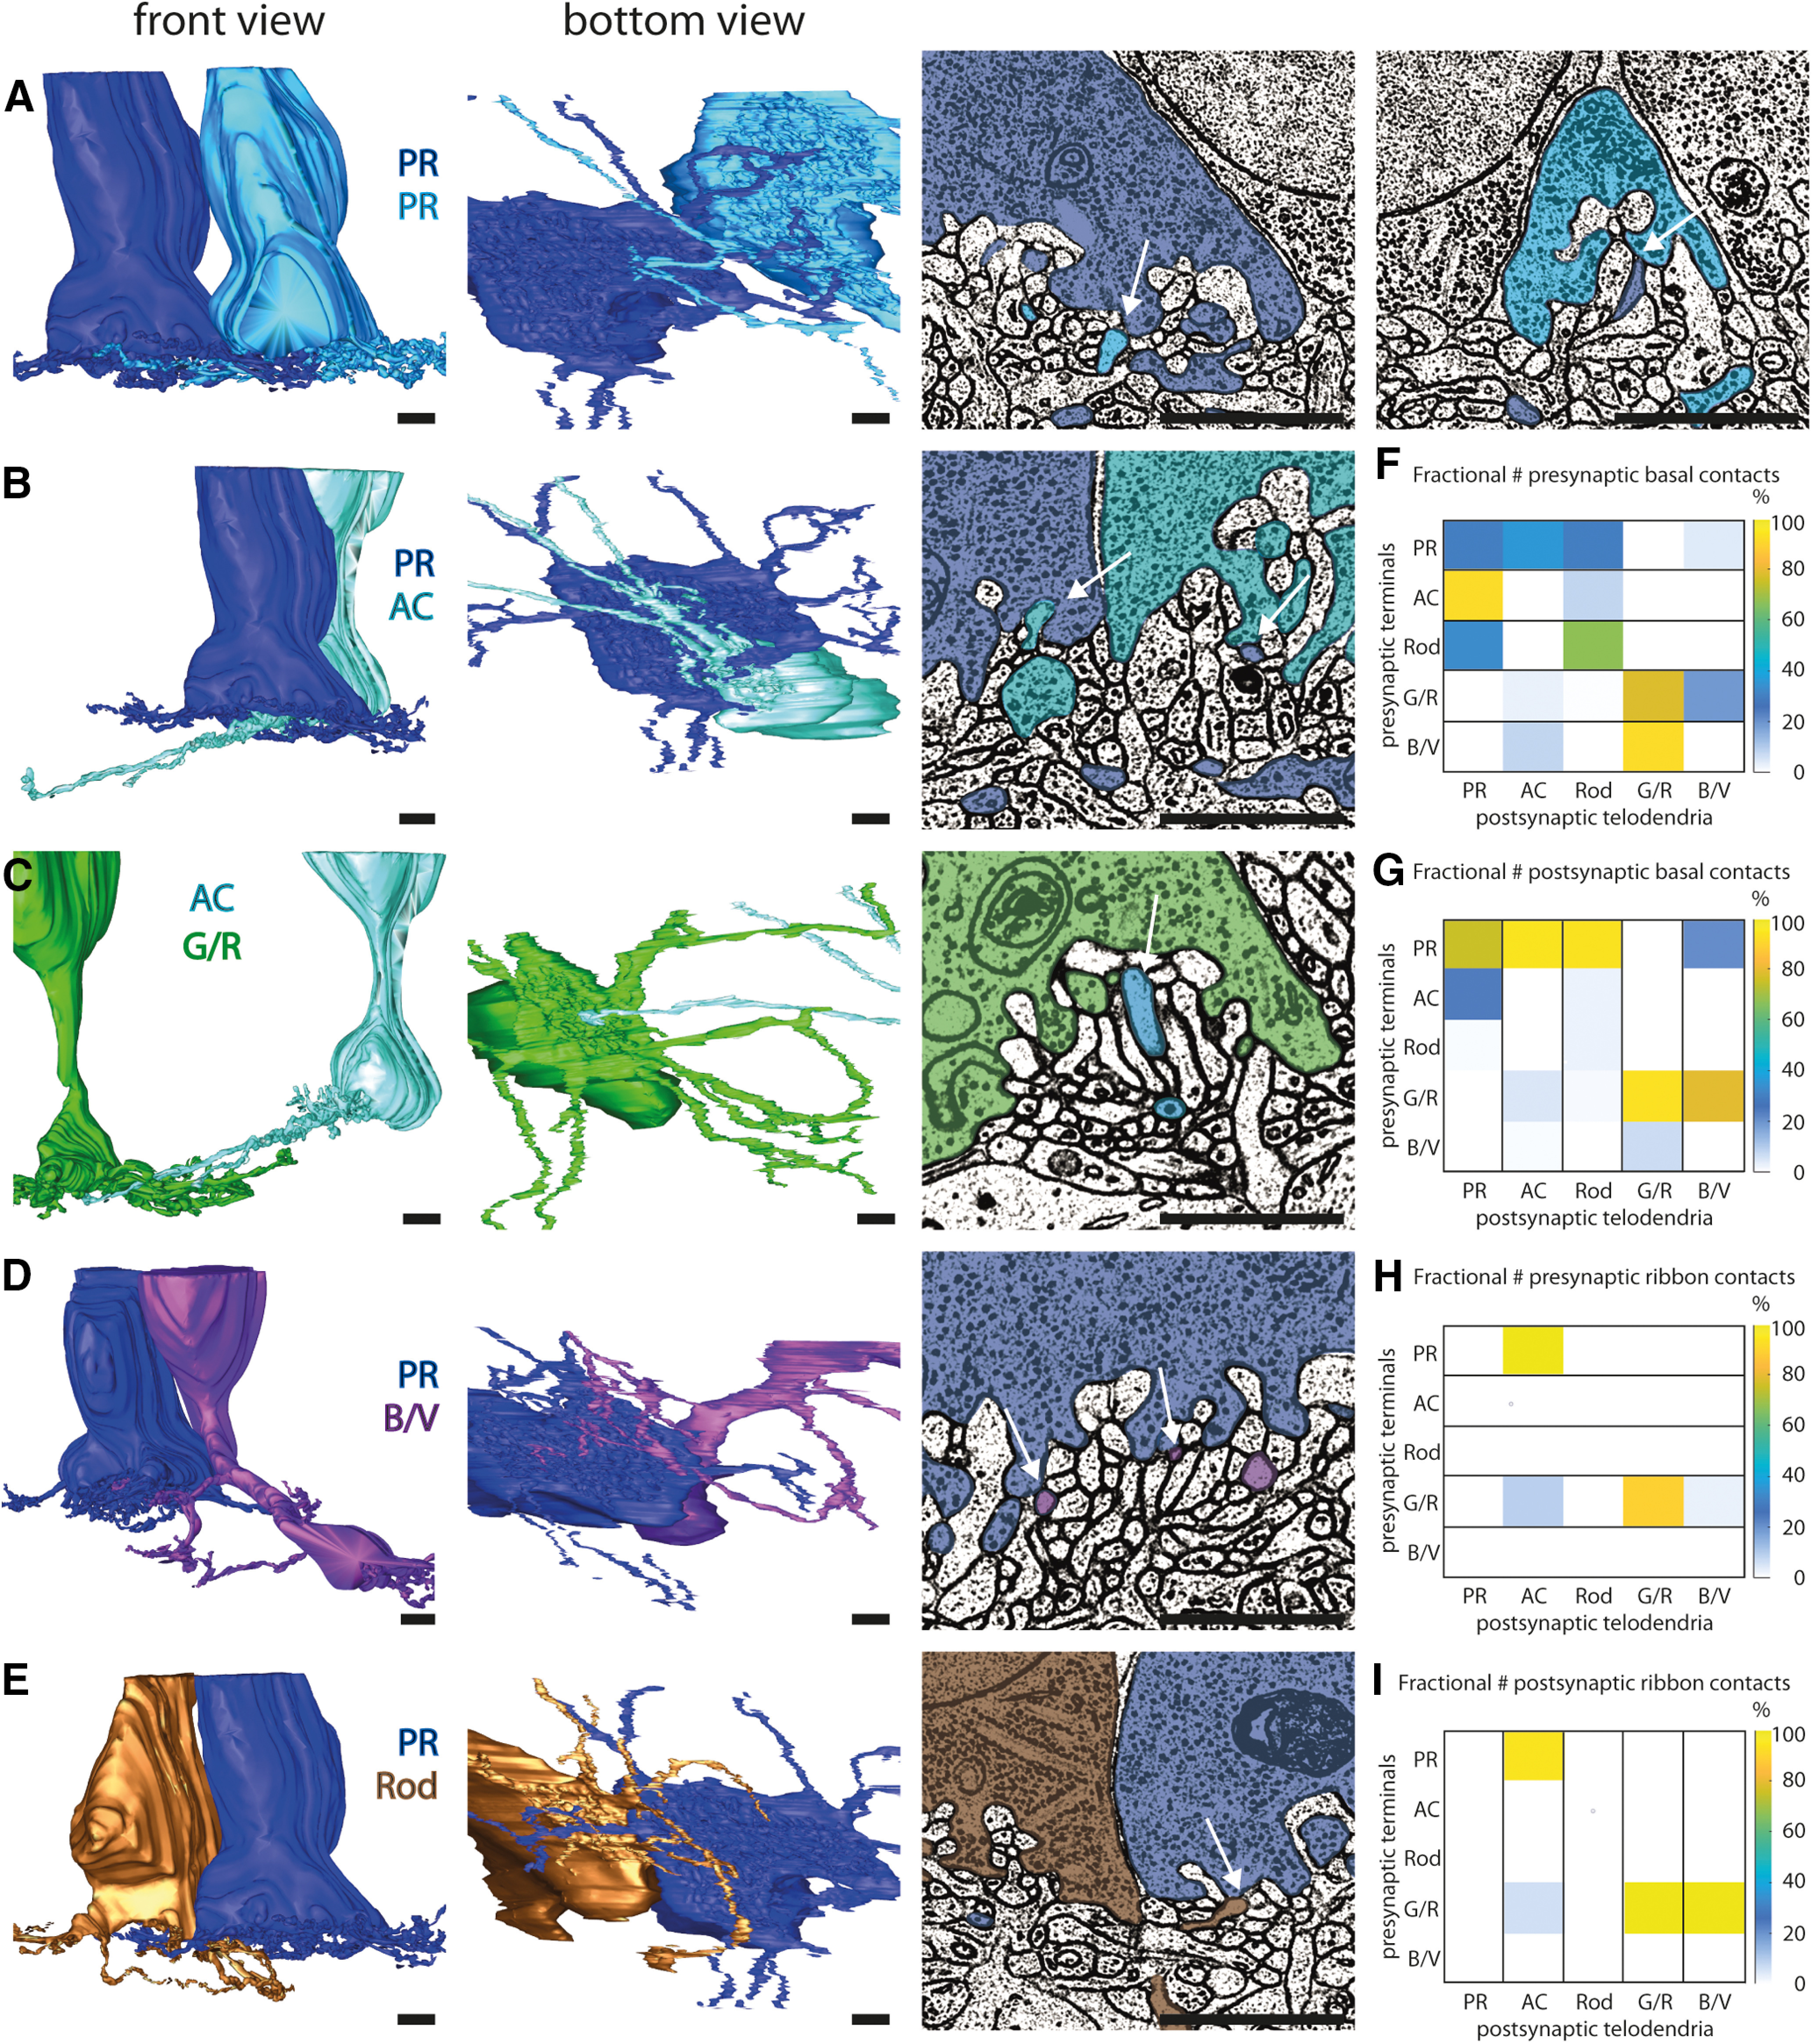
Connections from the double cone to other photoreceptors. The two images on the left show front and bottom views of two neighboring 3D reconstructed photoreceptor terminals. A, Contacts between the PRs of neighboring double cones (dark and bright blue). The electron microscopy (EM) images on the right show that both PRs make basal contacts in the neighboring PR terminal (white arrows). B, Contacts between the AC (turquoise) and PR (dark blue) of a double cone. The EM image on the right shows that double-cone members make basal contacts in the other member's terminal, and that the AC additionally makes contacts through ribbon synapses in the PR terminal (white arrows). C, Contact between the AC (turquoise) and a G/R cone (green). The two images on the left indicate that only the AC makes a contact to the G/R cone terminal but not the other way around. The EM image on the right shows that the AC makes a ribbon synapse contact to the G/R cone terminal. D, Contact between the PR of a double cone and a B/V cone. The two images on the left indicate that only the B/V cone makes contacts to the PR terminal, whereas the PR does not seem to contact the B/V cone terminal. The EM image on the right shows that the B/V cone makes multiple basal contacts to the PR terminal. E, Contacts between PR and rods. The EM images show that only the rod makes a basal contact with the PR terminal, but not the other way around. F, Connectivity matrix with percentage representations (see Materials and Methods) of presynaptic basal contacts from PR (total contacts = 248), AC (total contacts = 26), rods (total contacts = 3), G/R (total contacts = 180), and B/V (total contacts = 12). G, Connectivity matrix with percentage representations of postsynaptic basal contacts from PR (total contacts = 100), AC (total contacts = 96), rods (total contacts = 79), G/R (total contacts = 151), and B/V (total contacts = 43). H, Connectivity matrix with percentage representations of presynaptic ribbon contacts from PR (total contacts = 45), AC (total contacts = 0), rods (total contacts = 0), G/R (total contacts = 35), and B/V (total contacts = 0). I, Connectivity matrix with percentage representations of postsynaptic ribbon contacts from PR (total contacts = 0), AC (total contacts = 48), rods (total contacts = 0), G/R (total contacts = 31), and B/V (total contacts = 1). Tip-to-tip and tip-to-shaft photoreceptor contacts are shown in Extended Data Figure 3-1, and the synaptic connectivity of a principal member terminal is shown in Extended Data Figure 3-2. All photoreceptor cell contacts are shown in Extended Data Figures 3-3, 3-4, 3-5, 3-6. Scale bars, 2 μm.
