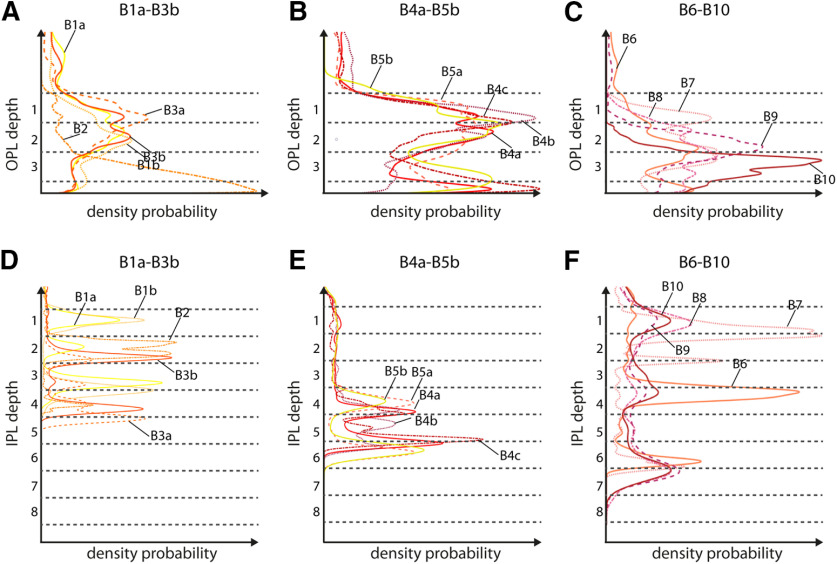
Figure 5.
Stratification level of the individual bipolar cell types in the OPL and IPL. A–C, Bipolar cell stratification profile in the OPL represented by a probability density function estimate for bipolar cell types B1a–B3b, B4a–B5b, and B6–B10, respectively. Density functions are calculated based on the volume of the cells along OPL depth. Dendrites increase in volume with increasing distance to the connected terminals. Therefore, the OPL density estimate is slightly shifted toward the INL, and the peak density estimate does not represent the area of synaptic contacts. D–F, Bipolar cell stratification profile in the IPL represented by a probability density function estimate for bipolar cell types B1a–B3b, B4a–B5b, and B6–B10, respectively.

