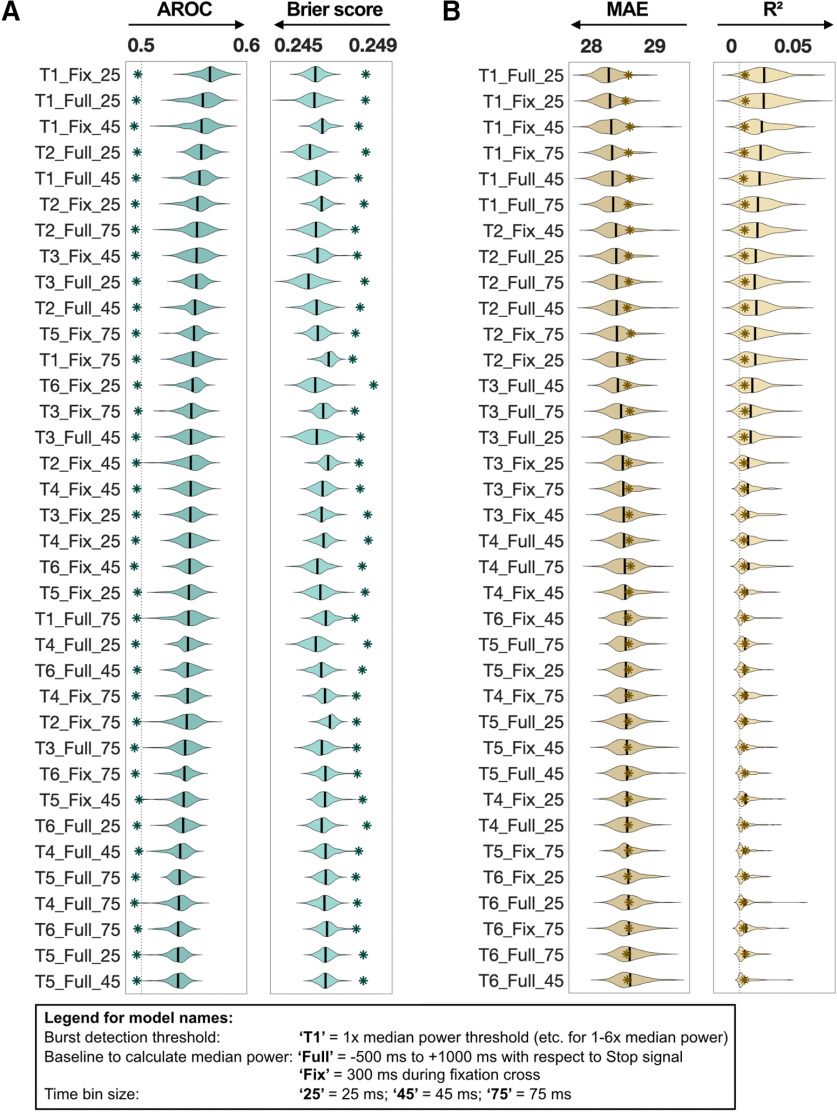
Figure 2.
Machine learning results for Optimal β-burst detection method and time bin size (see section in Materials and Methods; 36 parameter combination models: burst detection threshold × baseline for median power calculation × time bin size). A, Logistic regression results over 100 iterations for the Stop trial classification are shown. Two performance metrics are reported: AROC and Brier score. The models are sorted by AROC from most predictive to least predictive. Respective null models of each model are indicated with an asterisk symbol. B, Linear regression results over 100 iterations for SSRT prediction are shown. Two performance metrics are reported; MAE and R2. The models are sorted by MAE from most predictive to least predictive. Respective null models of each model are indicated with an asterisk symbol. Arrows below each performance metric indicate the direction for higher prediction.

