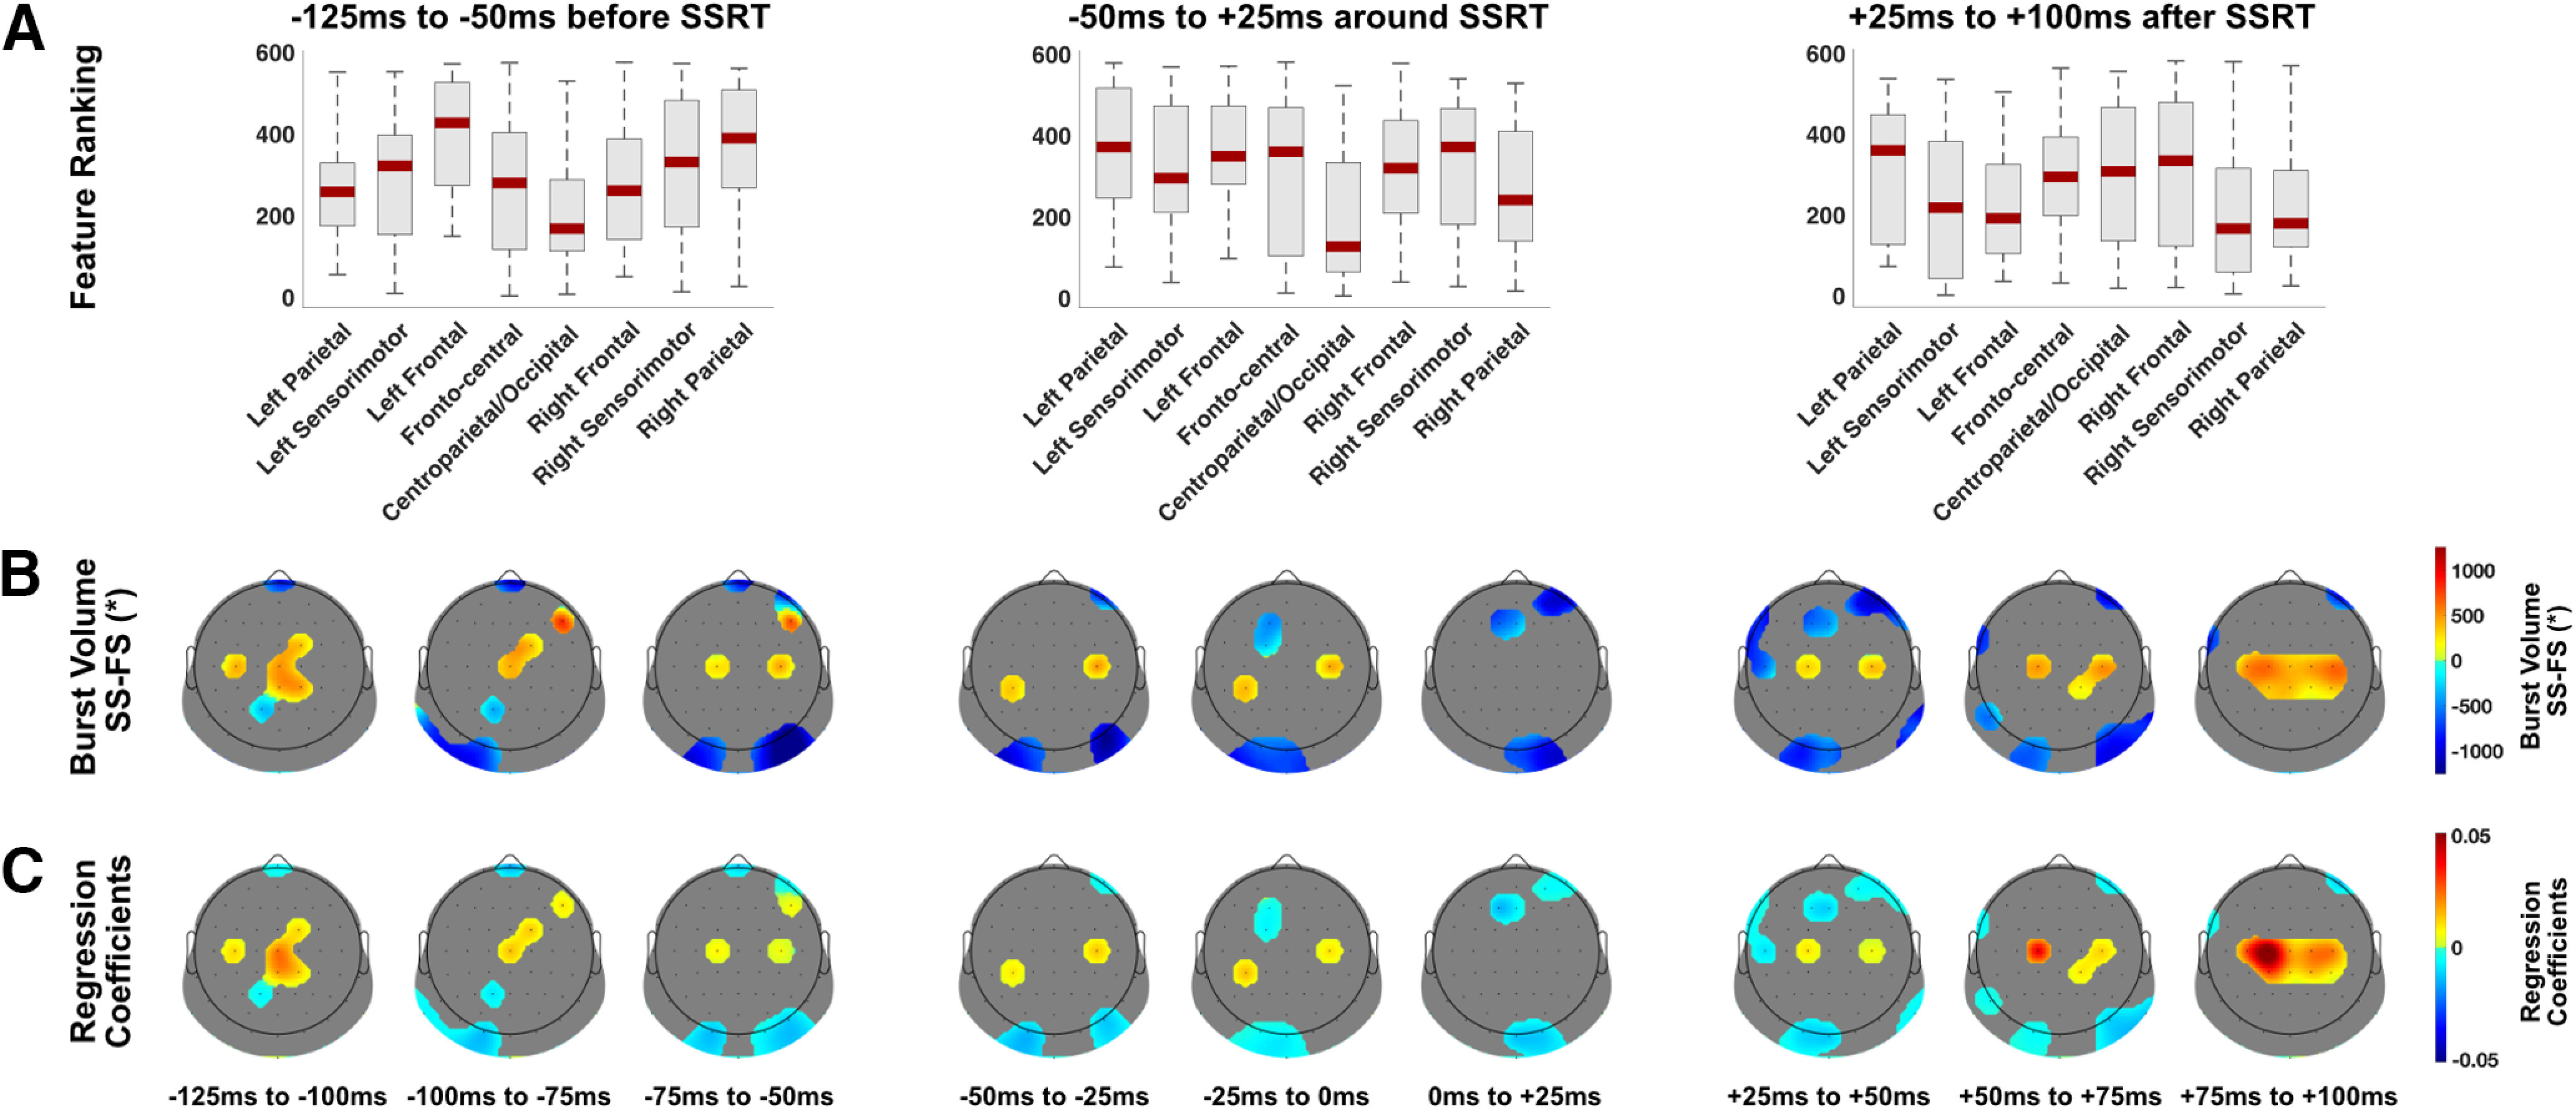
Figure 4.

Spatial and temporal β-burst volume dynamics for the Stop trial classification. A, Boxplots display the machine learning feature ranking (ranked after selection frequency and absolute regression coefficient). Low ranking means more predictive in the machine learning analysis. These were averaged over three time bins (75 ms each) and for each time bin averaged over eight different brain regions. B, β-burst volume data (successful minus failed Stop trials, a.u.) from the top 75 features (over all time bins) are shown for each 25-ms time bin with the rest of the electrodes masked. C, Regression coefficients from the machine learning logistic regression analysis from the top 75 features (over all time bins) are shown for each 25-ms bin with the rest of the electrodes masked. SS, successful Stop trial; FS, failed Stop trial. *β-burst volume is burst duration × frequency span × amplitude.
