Fig. 1.
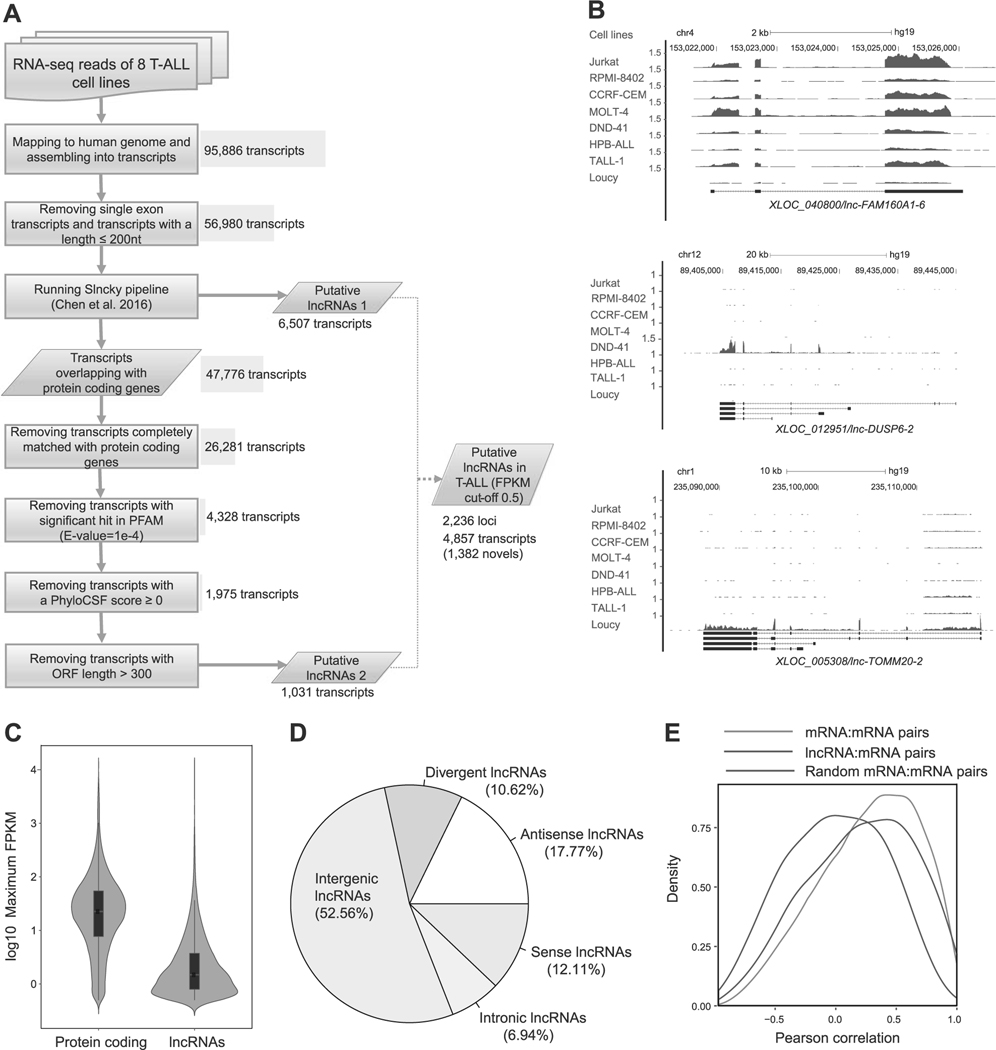
Identification of lncRNAs expressed in T-ALL cells. a Schematic diagram of the analytical pipeline. See Materials and Methods for details. b RNA-seq gene tracks showing the expression and genomic loci of three representative lncRNAs expressed in T-ALL cell lines: XLOC_040800/lnc-FAM160A1–6 (top), XLOC_012951/lnc-DUSP6–2 (middle), and XLOC_005308/lnc-TOMM20–2 (bottom). The x axis indicates the linear sequence of genomic DNA and the yaxis indicates the number of mapped reads per million. The black horizontal bar indicates the genomic scale in kilobases (kb). Black boxes in the gene map represent exons, and arrows indicate the location and direction of the transcriptional start site. c Violin plots showing expression levels of protein-coding genes and lncRNAs in T-ALL. The y axis indicates the maximum FPKM values (log10) of protein-coding genes and lncRNAs among eight T-ALL cell lines. Black boxes represent median and quartile expression levels. d Pie chart showing the percentage of each class of lncRNA. See Supplementary Figure 1A for details of classification. e Density distributions showing pairwise Pearson’s correlations between loci. Pairs were selected for lncRNAs or protein-coding genes (mRNA) with their neighboring protein-coding genes. As a control, 1000 mRNA–mRNA pairs were randomly selected. The y axis indicates density at each correlation value (x-axis).

