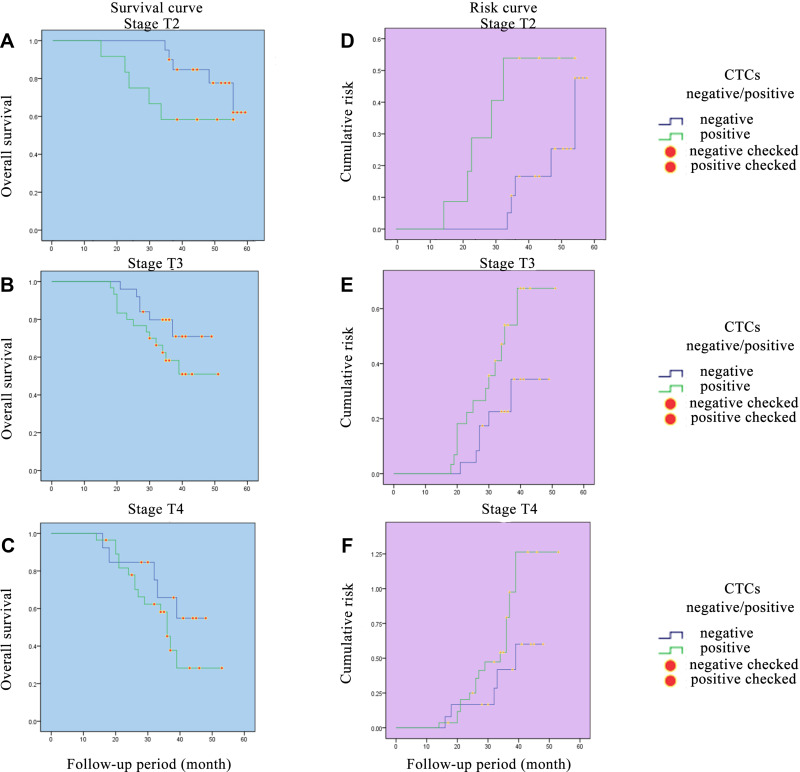
Figure 4.
Survival curves and risk curves of colorectal patients in different T stages. (A) Survival curve of colorectal patients in stage T2. (B) Survival curve of colorectal patients in stage T3. (C) Survival curve of colorectal patients in stage T4. (D) Risk curve of colorectal patients in stage T2. (E) Risk curve of colorectal patients in stage T3. (F) Risk curve of colorectal patients in stage T4.

