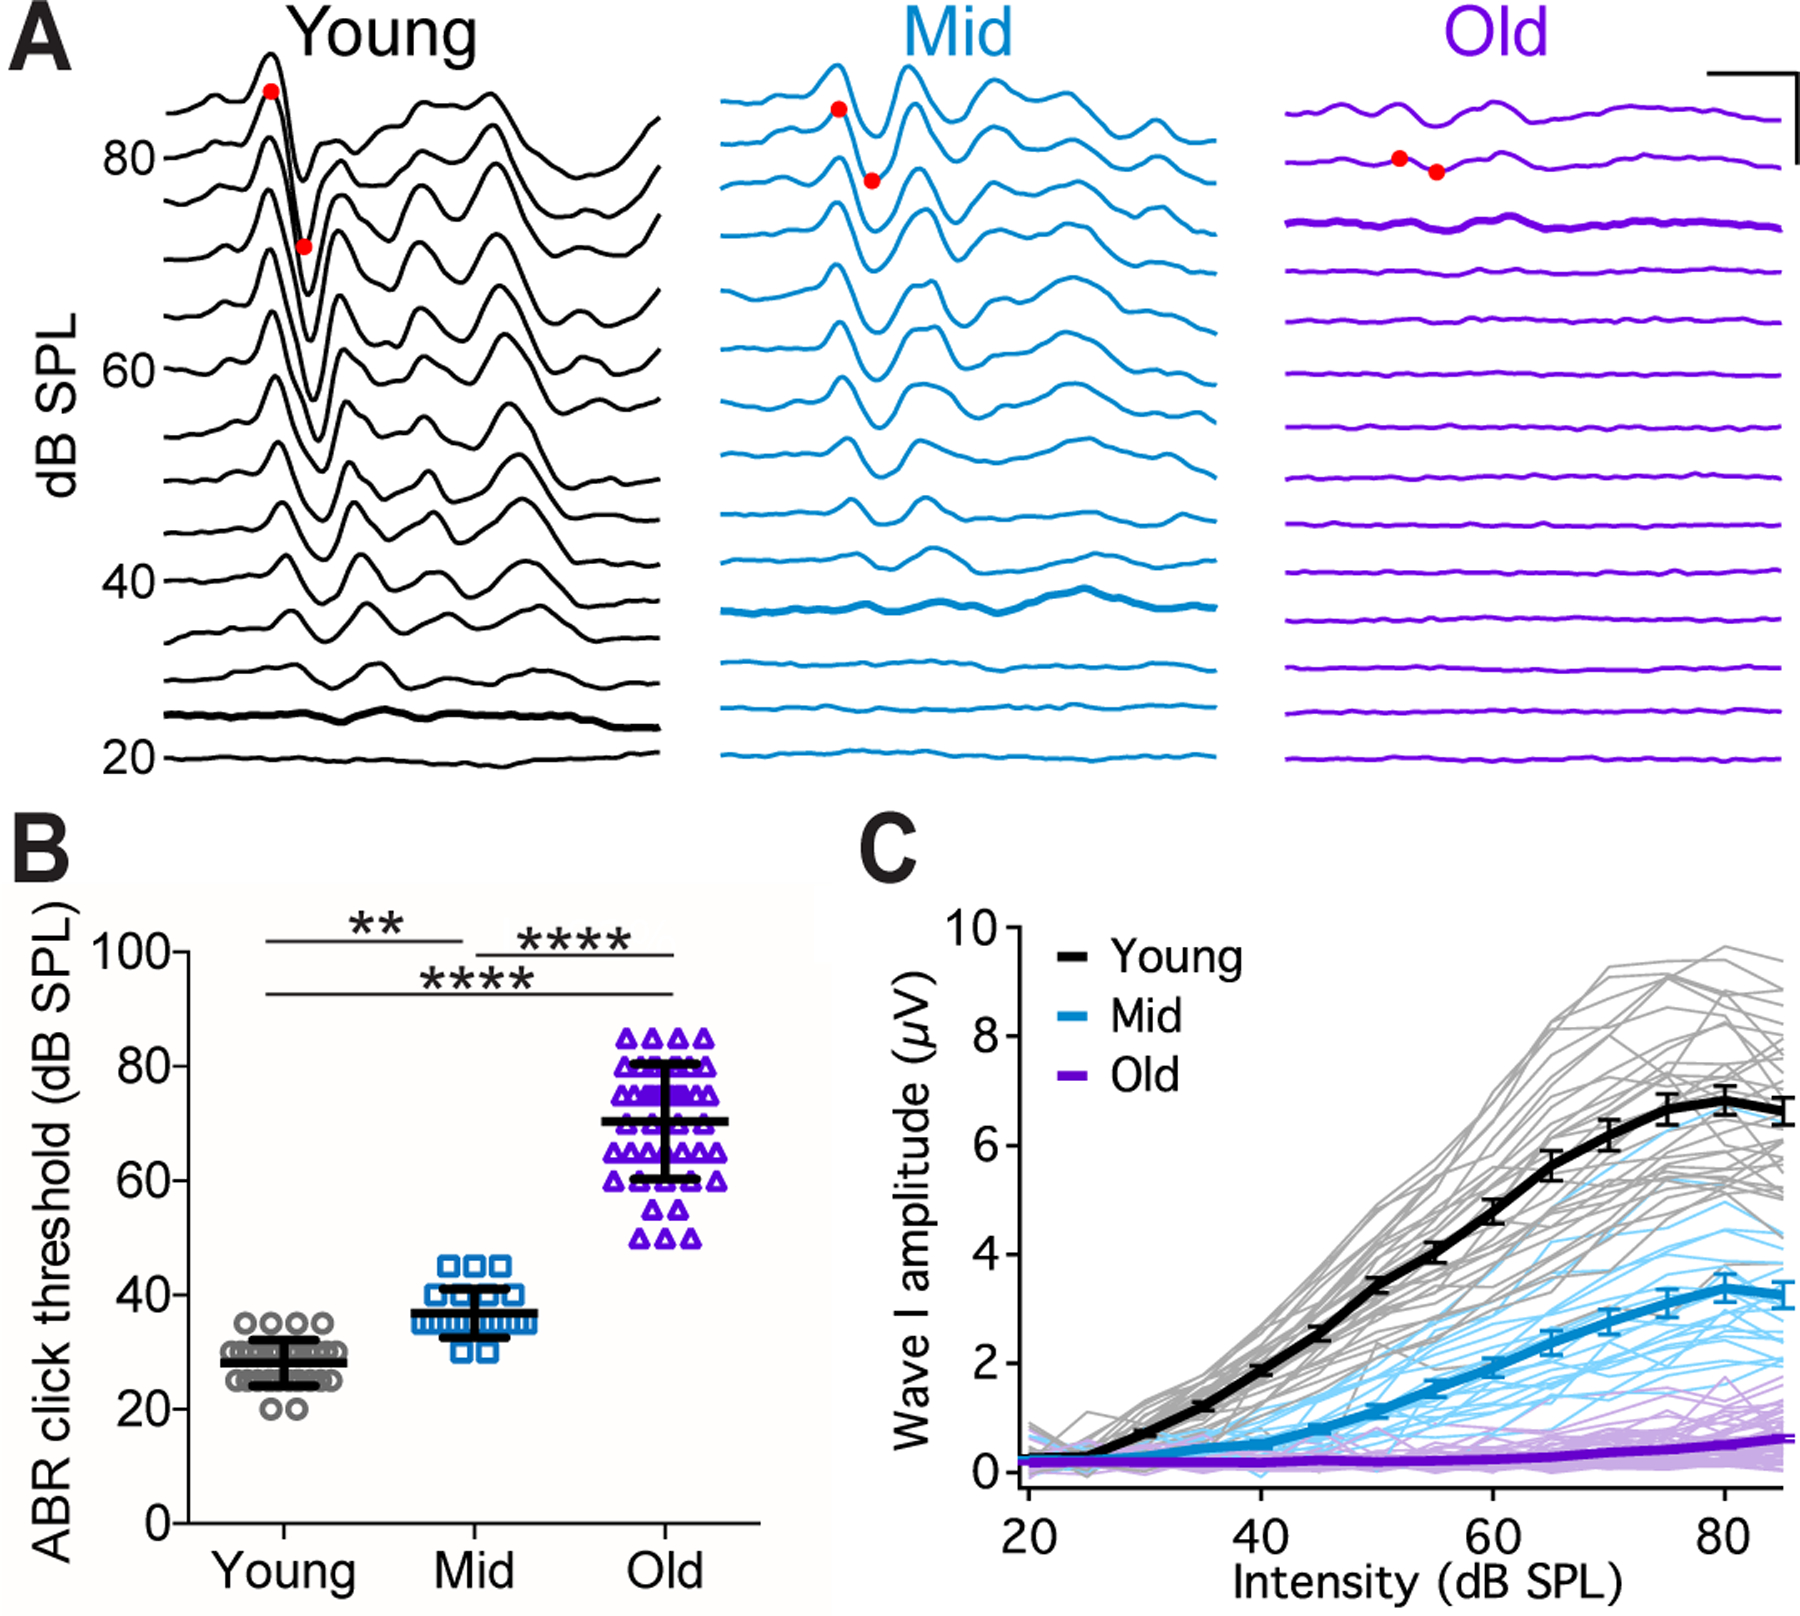
Figure 1. CBA/CaJ mice show age-related hearing loss (ARHL).

(A) Example ABR waveforms from mice at different ages to clicks at different intensities. Red dots mark the positive and negative peaks of ABR wave I at 80 dB SPL. Thick traces: ABR threshold trace. Scale: 2 ms, 5 μV.
(B) ABR click thresholds in 32 young, 22 middle-aged, and 43 old mice. Dunn’s multiple comparisons test: **p < 0.001; ****p < 0.0001. ABR threshold was beyond 85 dB SPL in 12 old mice and not determined.
(C) Growth curves of ABR wave I amplitude in all mice. Thin lines: individual mice; thick lines: average of each age group, with error bars represent SEM.
