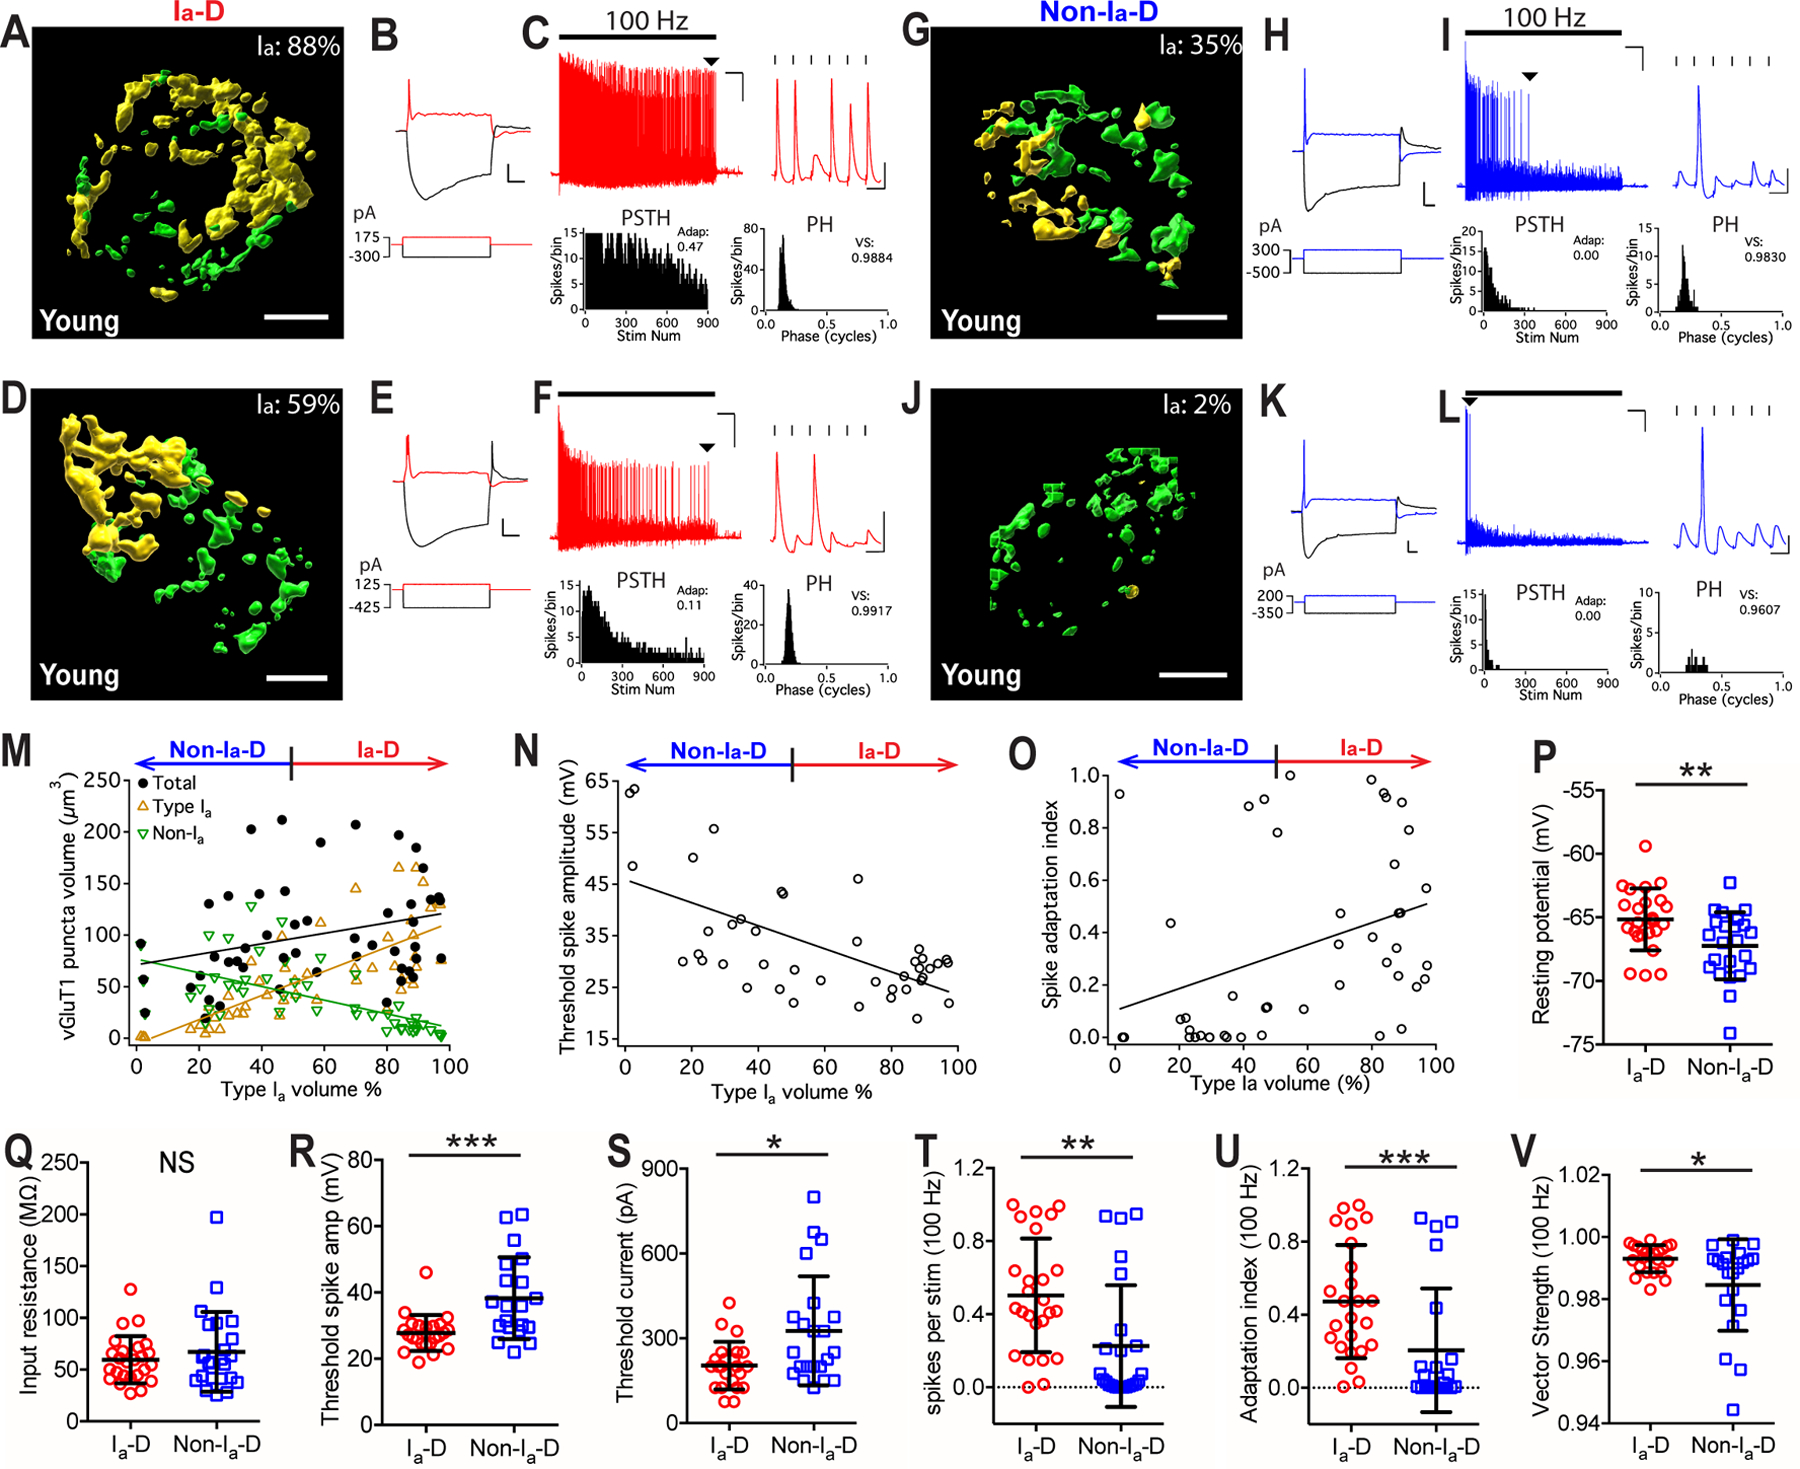
Figure 3. The proportion of type Ia synaptic inputs correlates with physiological properties of postsynaptic neurons in young mice.

(A-C) An example bushy neuron that received mostly type Ia synaptic inputs (Ia-dominant, or Ia-D) from the AN. (A) Reconstructed VGluT1-labeled puncta surrounding the soma of the target bushy cell (not shown) from type Ia (yellow) and non-type Ia (green) synapses. Ia%: volume proportion of the VGluT1-labeled puncta from type Ia synapses over total. Scale: 5 μm. (B) Responses of the bushy cell to current step injections. Red traces: threshold current injection (bottom) and response (top). Scale: 10 mV and 20 ms. (C) The neuron fired sustained spikes to a train of auditory nerve stimulation (black bar) at 100 Hz; scale: 10 mV and 1 s. Arrowhead: last spikes of the train expanded in the inset on the right; scale: 10 mV and 10 ms. PSTH: post-stimulus time histogram. Stim Num: stimulus number. Adap: spike adaptation index. PH: period histogram. VS: vector strength.
(D-F) Another example bushy neuron with Ia-D but lower proportion of type Ia inputs.
(G-I, J-L) Two example bushy neurons that received mostly non-type Ia synaptic inputs (Non-type Ia-dominant, or Non-Ia-D), and fired only transient or onset spikes to AN stimulus trains.
(M) Bushy neurons with different proportion of type Ia inputs (x-axis) show correlated distribution in the total volume of VGluT1-labeled puncta (black), volume of type Ia only puncta (yellow), and volume of non-type Ia only puncta (green). Linear regression lines: black, r2 = 0.09, p = 0.039; yellow, r2 = 0.57, p < 0.0001; green, r2 = 0.38, p < 0.0001.
(N) The proportion of type Ia inputs (x-axis) in bushy neurons negatively correlates with their threshold spike amplitude, as shown by example responses in B, E, H and K. Linear regression line: r2 = 0.40, p < 0.0001.
(O) Bushy neurons with different proportion of type Ia inputs (x-axis) show different firing patterns to 100 Hz stimulus trains, as quantified by spike adaptation index. Linear regression line: r2 = 0.13, p = 0.015.
(P-V) Comparisons between bushy neurons with Ia-D and Non-Ia-D inputs in resting potential (P), input resistance (Q), threshold spike amplitude (R), threshold current injection level that triggered the first spike (S), firing rate throughout the 100 Hz train (T), spike adaptation index (U), and vector strength of the spikes (V). Unpaired t-test or Mann-Whitney test: NS, p > 0.05; *p < 0.05; **p < 0.01; ***p < 0.001.
