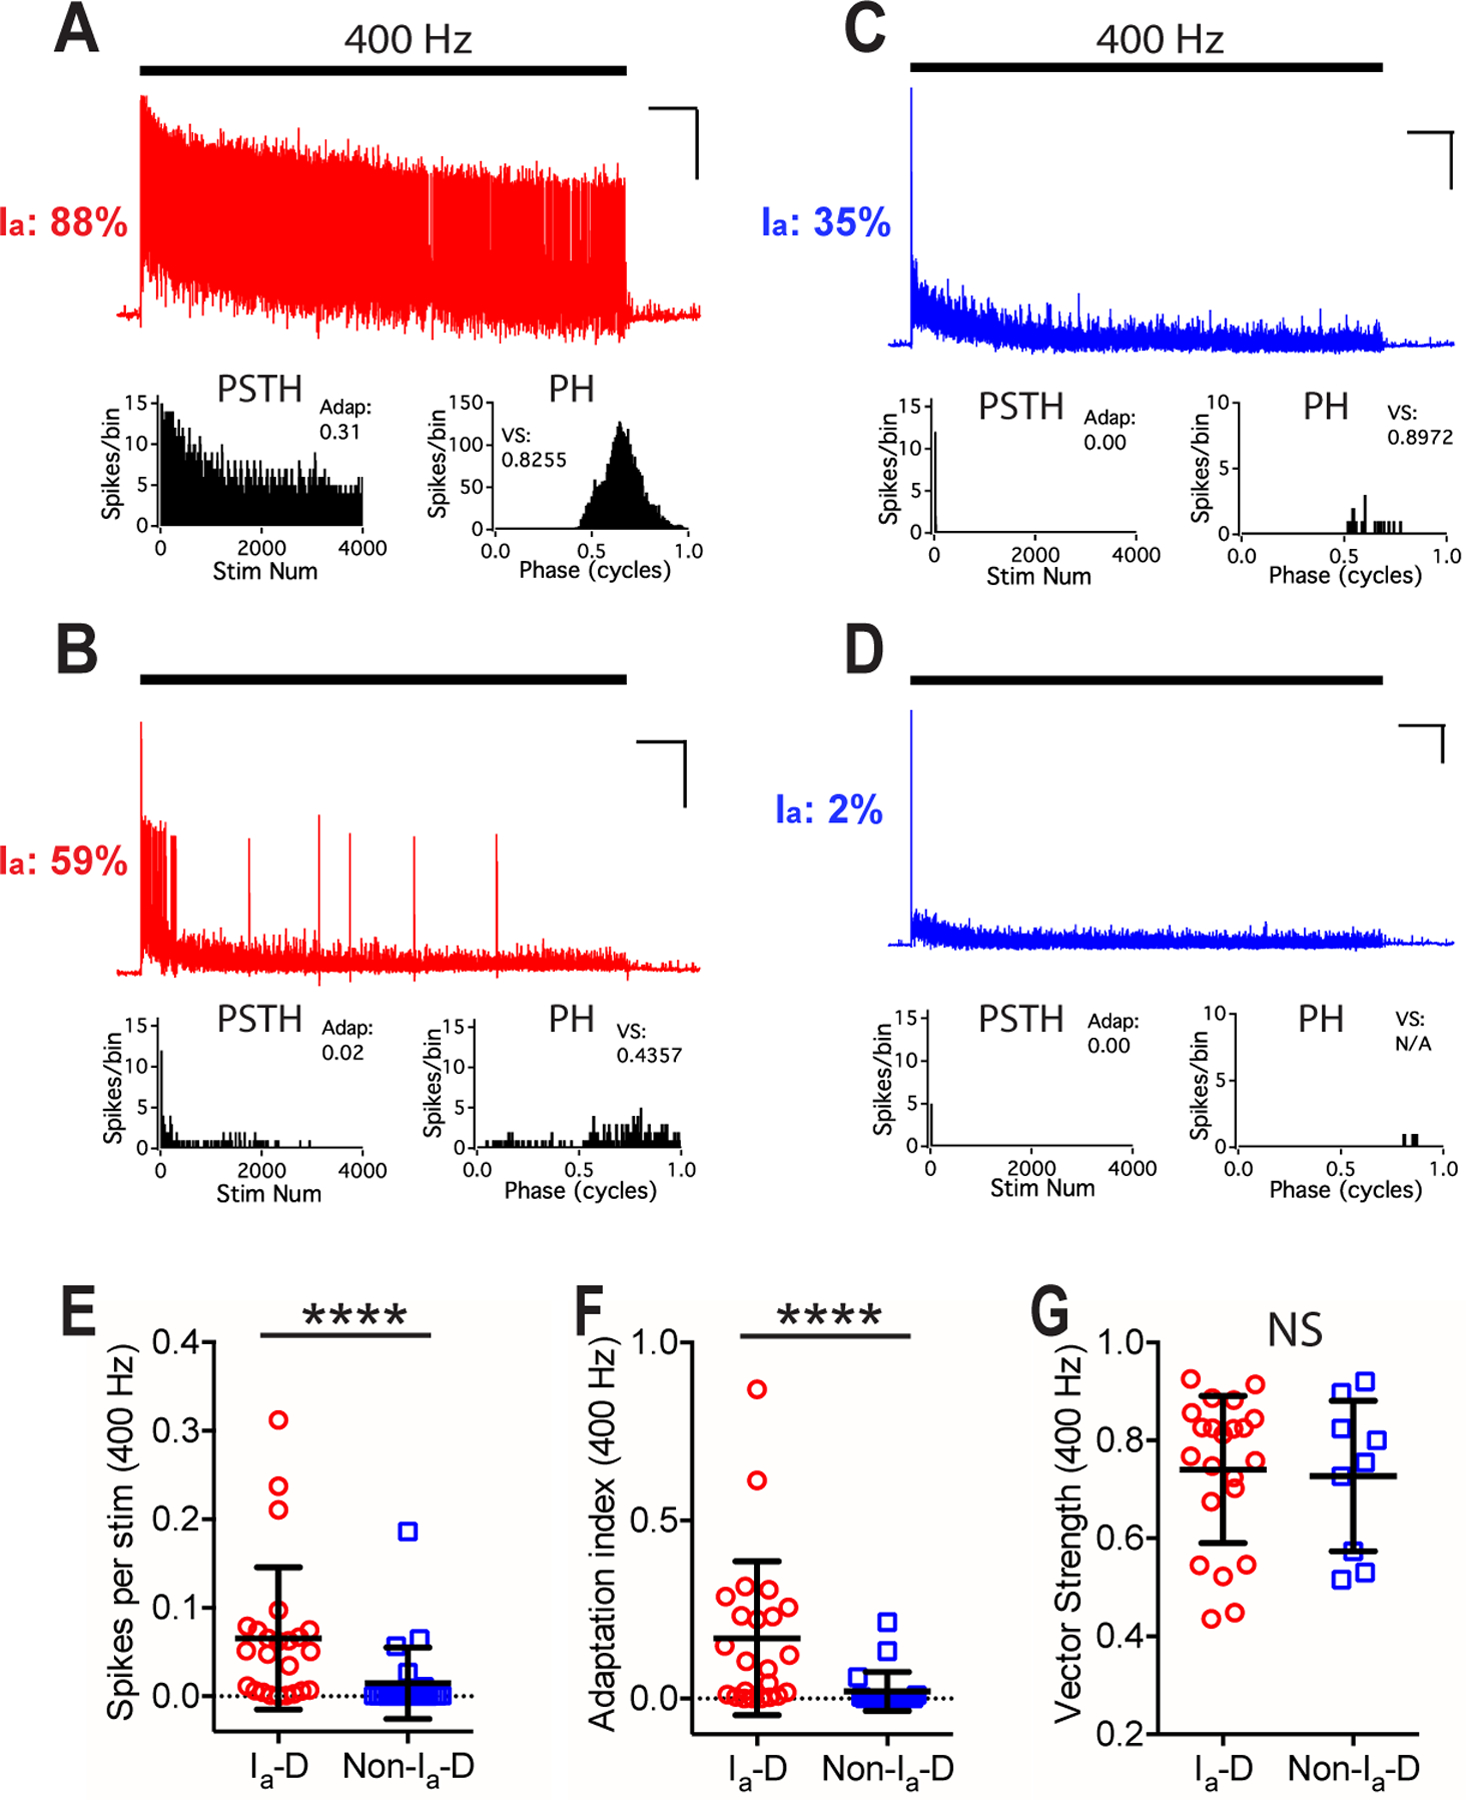
Figure 4. Bushy neurons with different convergence of AN synaptic inputs show different firing patterns to trains of AN stimulation at 400 Hz in young mice.

(A) The same example bushy neuron in Fig. 3A fired sustained spikes to trains of AN stimulation at 400 Hz. Scale: 10 mV and 1 s.
(B-D) Responses of bushy neurons in Fig. 3D, G, and J to AN stimulation at 400 Hz. Vector strength of the cell in D was not calculated due to insufficient number of spikes.
(E-G) Comparisons between bushy neurons with Ia-D inputs and Non-Ia-D inputs to 400 Hz AN stimulus trains in firing rate (E), spike adaptation index (F), and vector strength (G). Unpaired t-test or Mann Whitney test: NS, p > 0.05; ****p < 0.0001.
