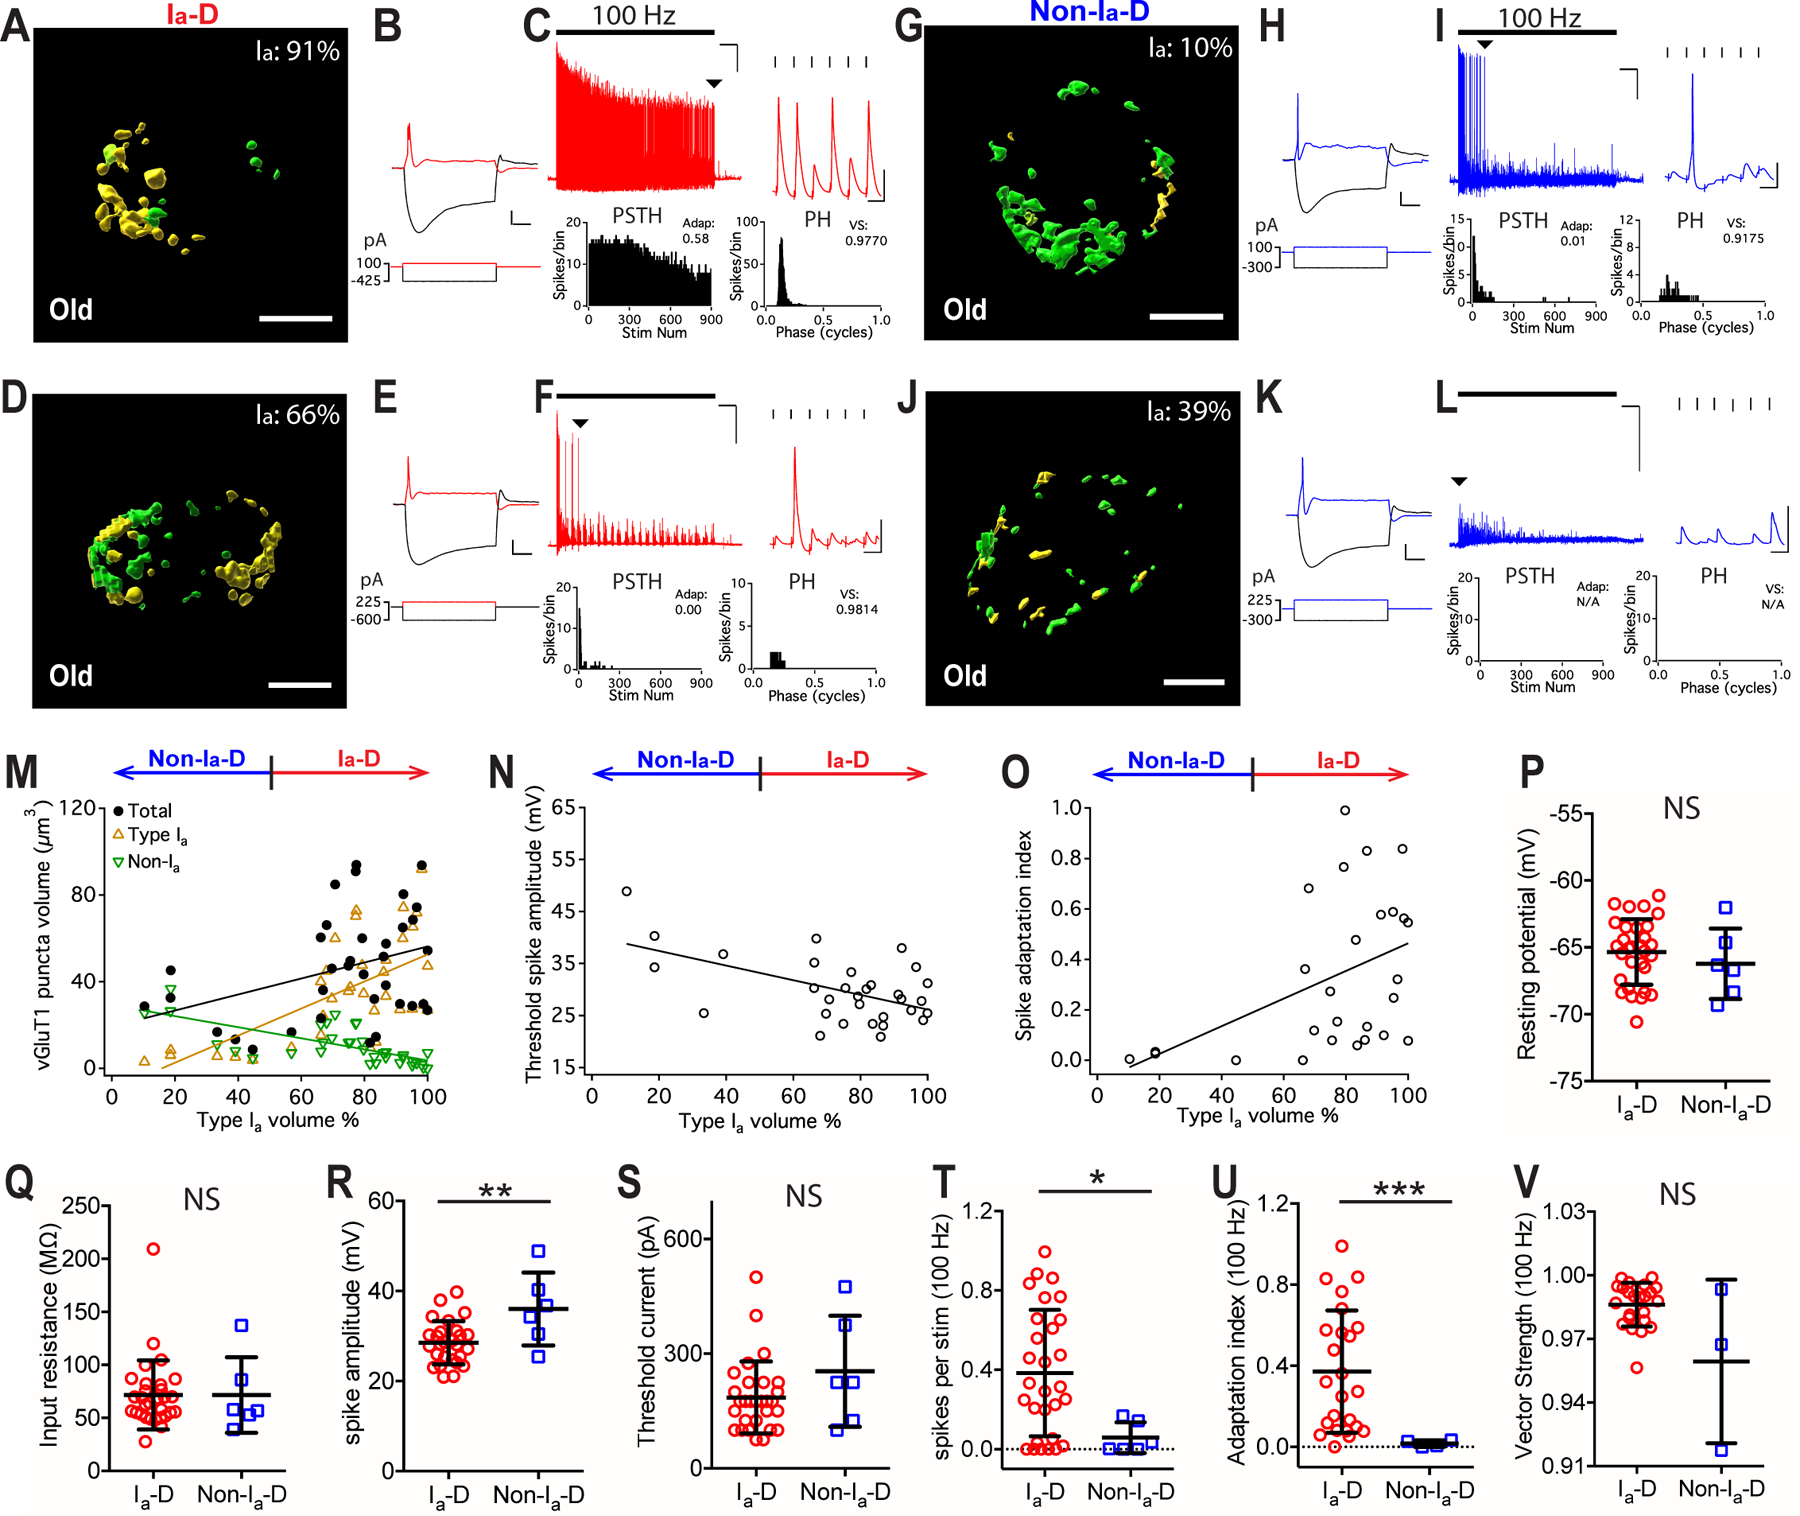
Figure 7. Convergence of different AN synapses and the response properties of postsynaptic bushy neurons in old mice.

(A-C) Example bushy neuron with Ia-D inputs (Ia: 91%). (A) Reconstructed VGluT1-labeled puncta from type Ia (yellow) and non-type Ia (green) synapses. Scale: 5 μm. (B) Responses of the bushy cell to current step injections. Scale: 10 mV and 20 ms. (C) The neuron fired sustained spikes to a train of auditory nerve stimulation at 100 Hz; scale: 10 mV and 1 s. Arrowhead: last spikes of the train expanded in the inset on the right; scale: 10 mV and 10 ms.
(D-F) Example bushy neuron with Ia-D but lower proportion of type Ia inputs (Ia: 66%).
(G-I, J-L) Two example bushy neurons that received Non-Ia-D inputs (Ia: 10% and 39%).
(M) Bushy neurons with different proportion of type Ia inputs show correlated distribution in the total volume of VGluT1-labeled puncta (black), volume of type Ia only puncta (yellow), and volume of non-type Ia only puncta (green). Linear regression lines: black, r2 = 0.13, p = 0.033; yellow, r2 = 0.40, p < 0.0001; green, r2 = 0.49, p < 0.0001.
(N) Proportion of type Ia inputs (x-axis) in bushy neurons negatively correlates with their threshold spike amplitude. Linear regression line: r2 = 0.30, p = 0.001.
(O) Spike adaptation index from 100 Hz trains in bushy neurons with different proportion of type Ia inputs (x-axis). Linear regression line: r2 = 0.20, p = 0.019.
(P-V) Comparisons between bushy neurons from old mice with Ia-D and Non-Ia-D inputs in resting potential (P), input resistance (Q), threshold spike amplitude (R), threshold current level (S), firing rate throughout the 100 Hz trains (T), spike adaptation index (U), and vector strength of the spikes (V). Unpaired t-test or Mann-Whitney test: NS, p > 0.05; *p < 0.05; ***p < 0.001.
