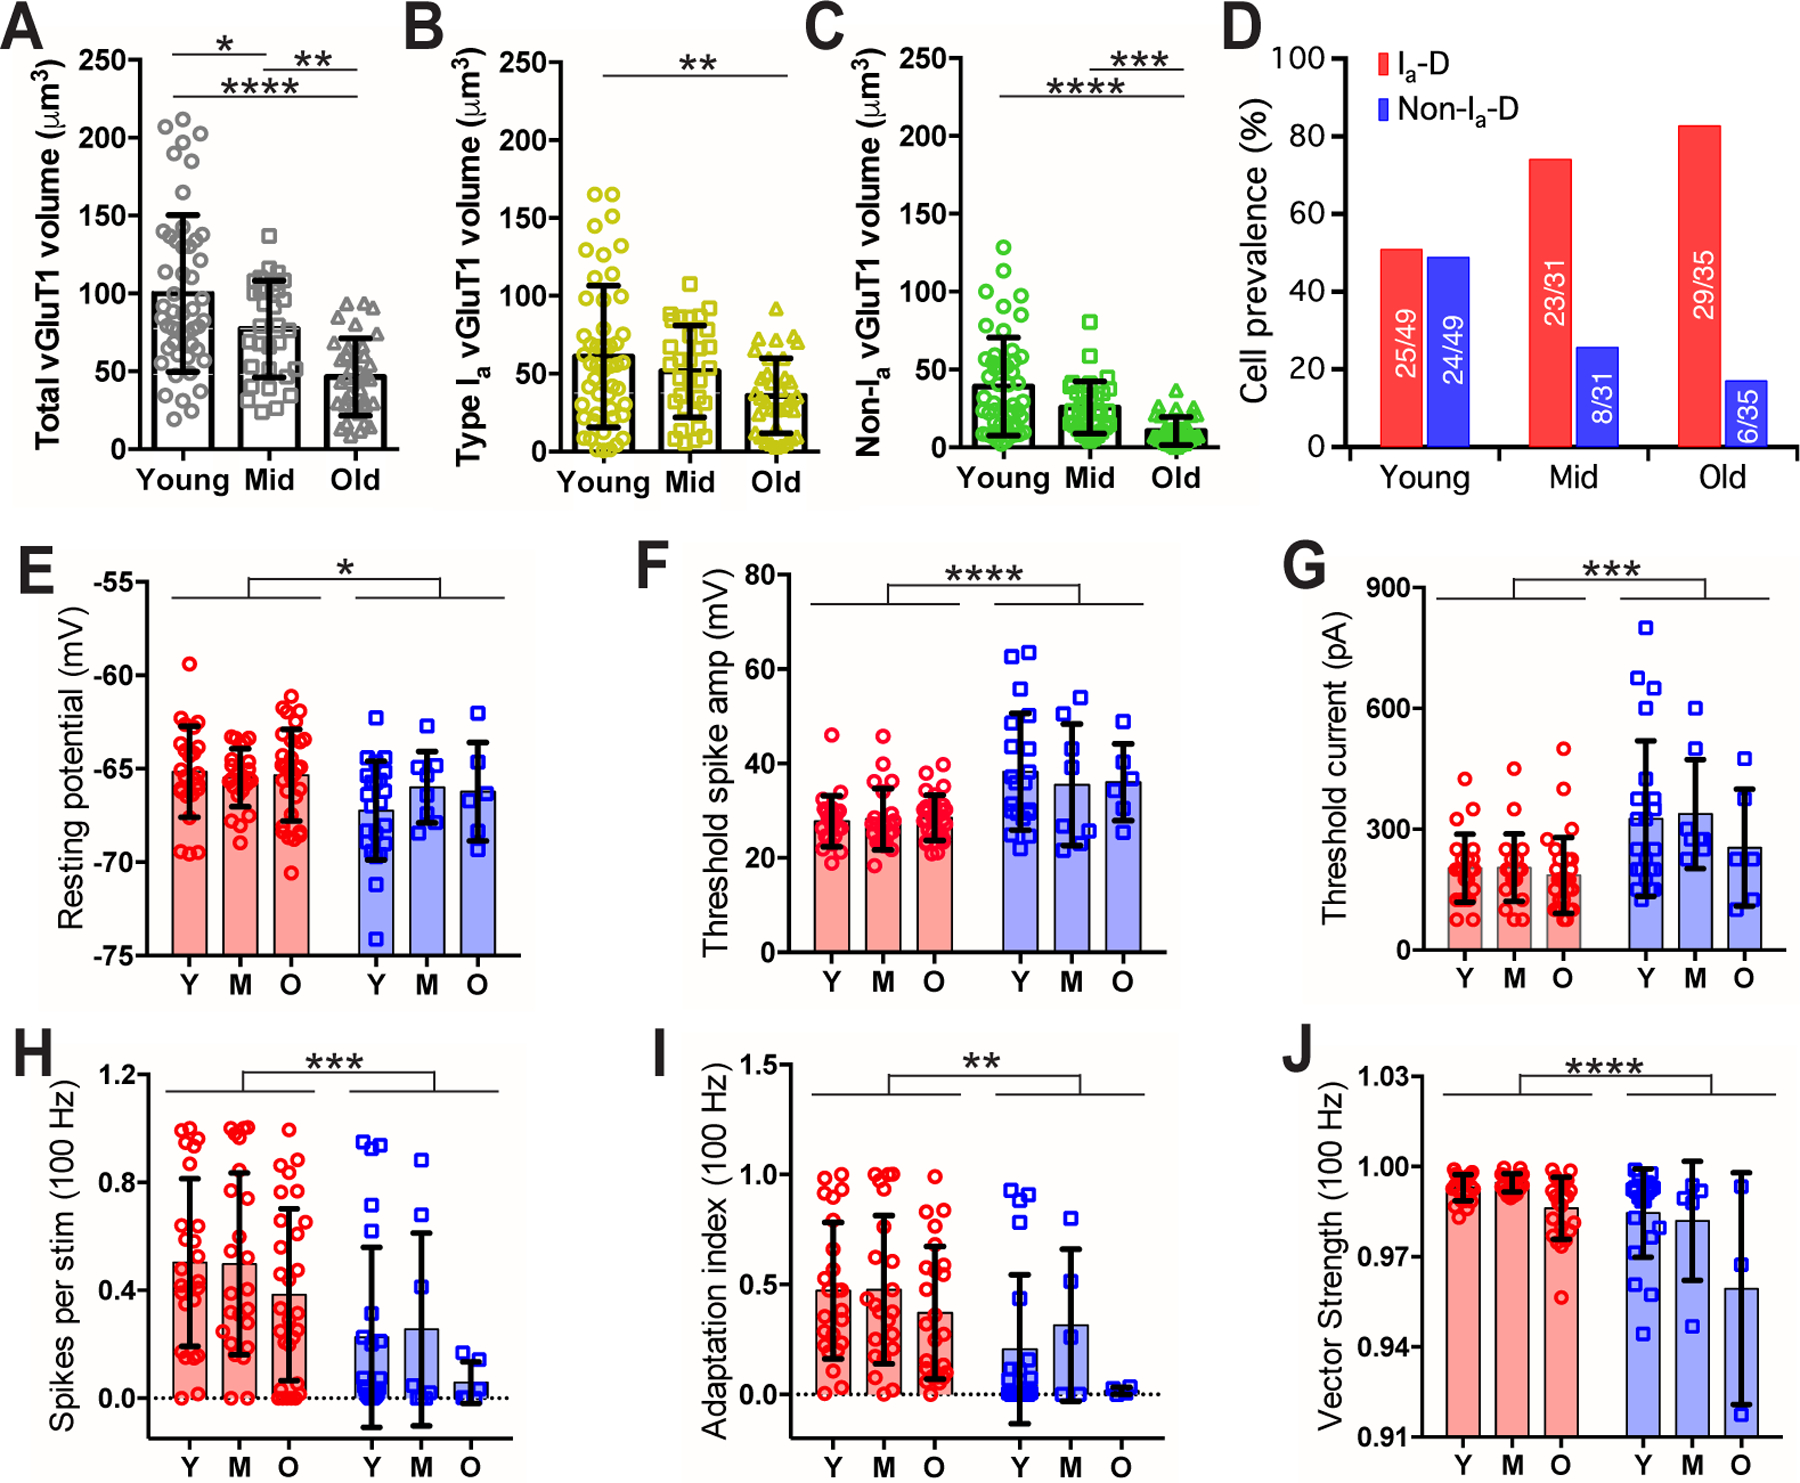
Figure 9. AN central synaptopathy is more severe in non-type Ia synapses and associated with altered composition of bushy neuron population during ARHL.

(A-C) Comparisons of the total volume (A), type Ia only volume
(B) and non-type Ia only volume (C) of VGluT1-labeled puncta onto bushy neurons from three age groups of mice. Tukey’s or Dunn’s multiple comparison tests: *p < 0.05; **p < 0.01; ***p < 0.001; ****p < 0.0001.
(D) Prevalence of bushy neurons that receive Ia-D and Non-Ia-D synaptic inputs among three age groups. Numbers mark the cell count of each type over total.
(E-J) Comparisons of bushy neurons among three age groups in resting potential (E), threshold spike amplitude (F), threshold current injection that triggered the first spike (G), firing rate to 100 Hz stimulation (H), spike adaptation index (I), and vector strength of the spikes throughout the 100 Hz trains (J). Two-way ANOVA revealed significant cell type effect (Ia-D vs. Non-Ia-D) in all panels (E-J): **p < 0.01; ***p < 0.001; ****p < 0.0001. Age effect was only significant in vector strength (J): p < 0.001.
