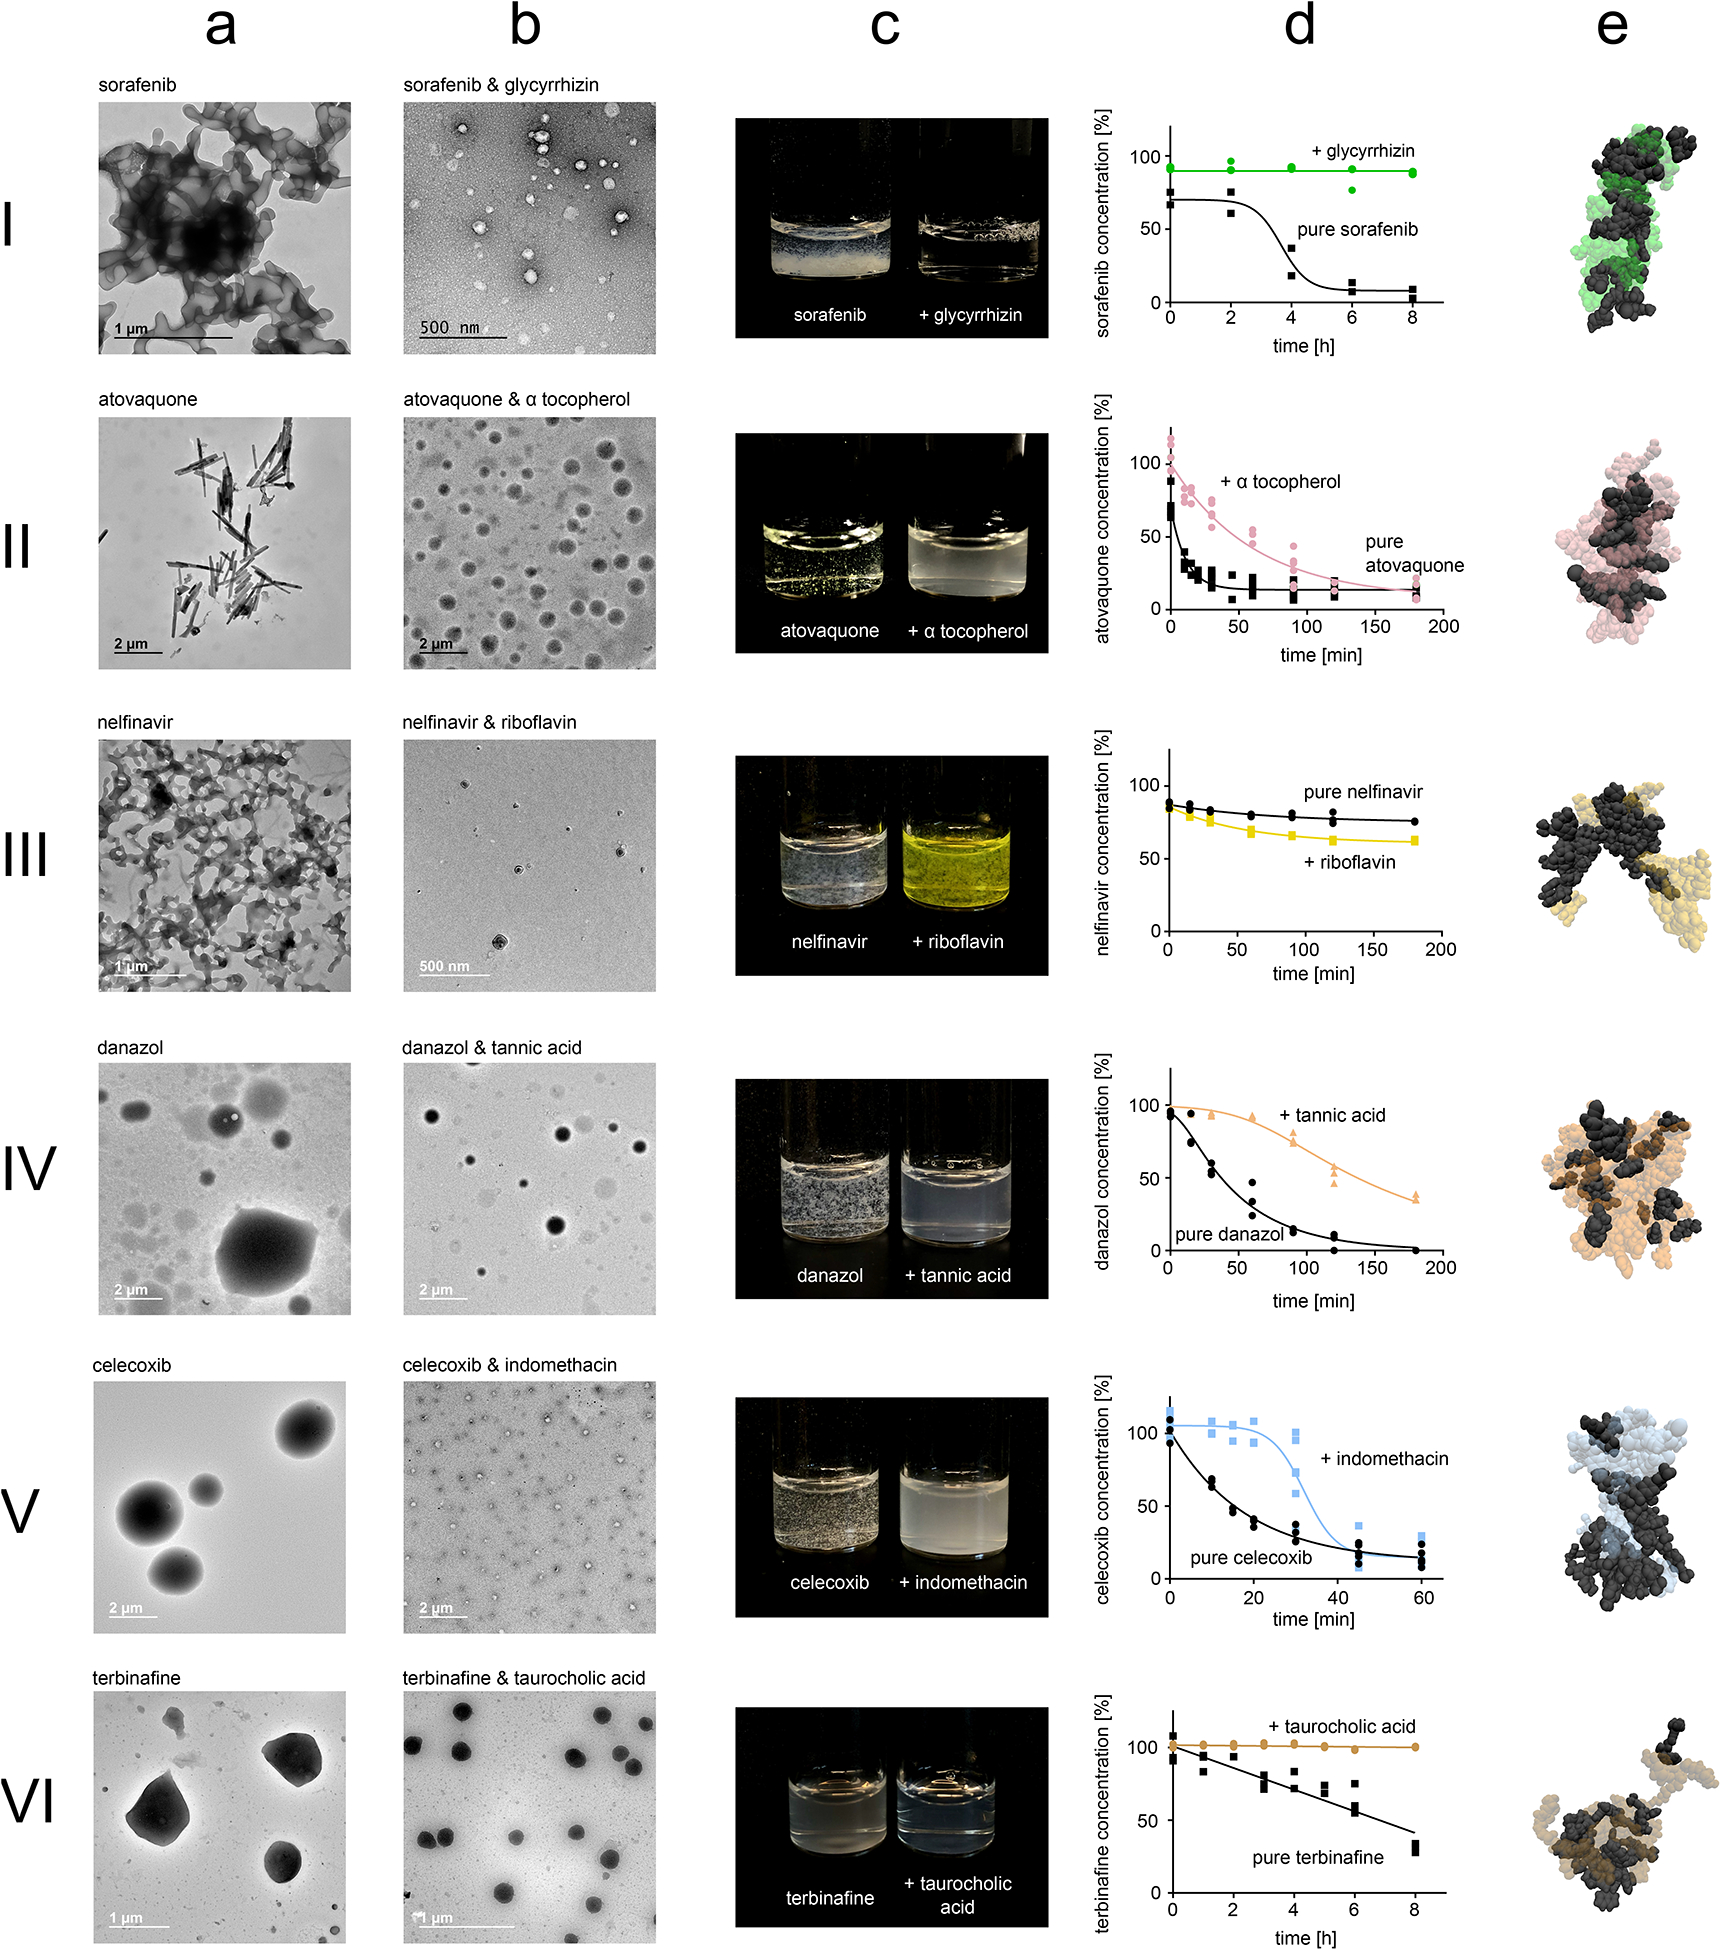
Figure 2: Computationally prioritized combinations of drugs and excipients form nanoparticles.

Numbering corresponds to edges highlighted in Figure 1e. Nanoparticle formation was primarily evaluated using dynamic light scattering (Supplementary Table 5). This data was further validated using TEM images of micron-sized aggregates formed by the pure drug (a) and TEM images of the nanoparticles formed by co-aggregating the drugs and excipients (b). Photos show dispersion of the nanoparticles compared to unformulated drug during concentration escalation experiments (c). Dispersion stability was quantified by analysing time-concentration curves according to OECD guidelines (d). Short molecular dynamic simulations map non-covalent interaction potential between drugs and excipients (e). In the MD visualizations, drugs are visualized through black Van der Waals-spheres, while excipients are visualized through transparent and coloured Van der Waals-spheres. For a, b, and c representative images are shown from ten acquisitions generated through two independent experiments, all images reproduced the here depicted behaviour.
