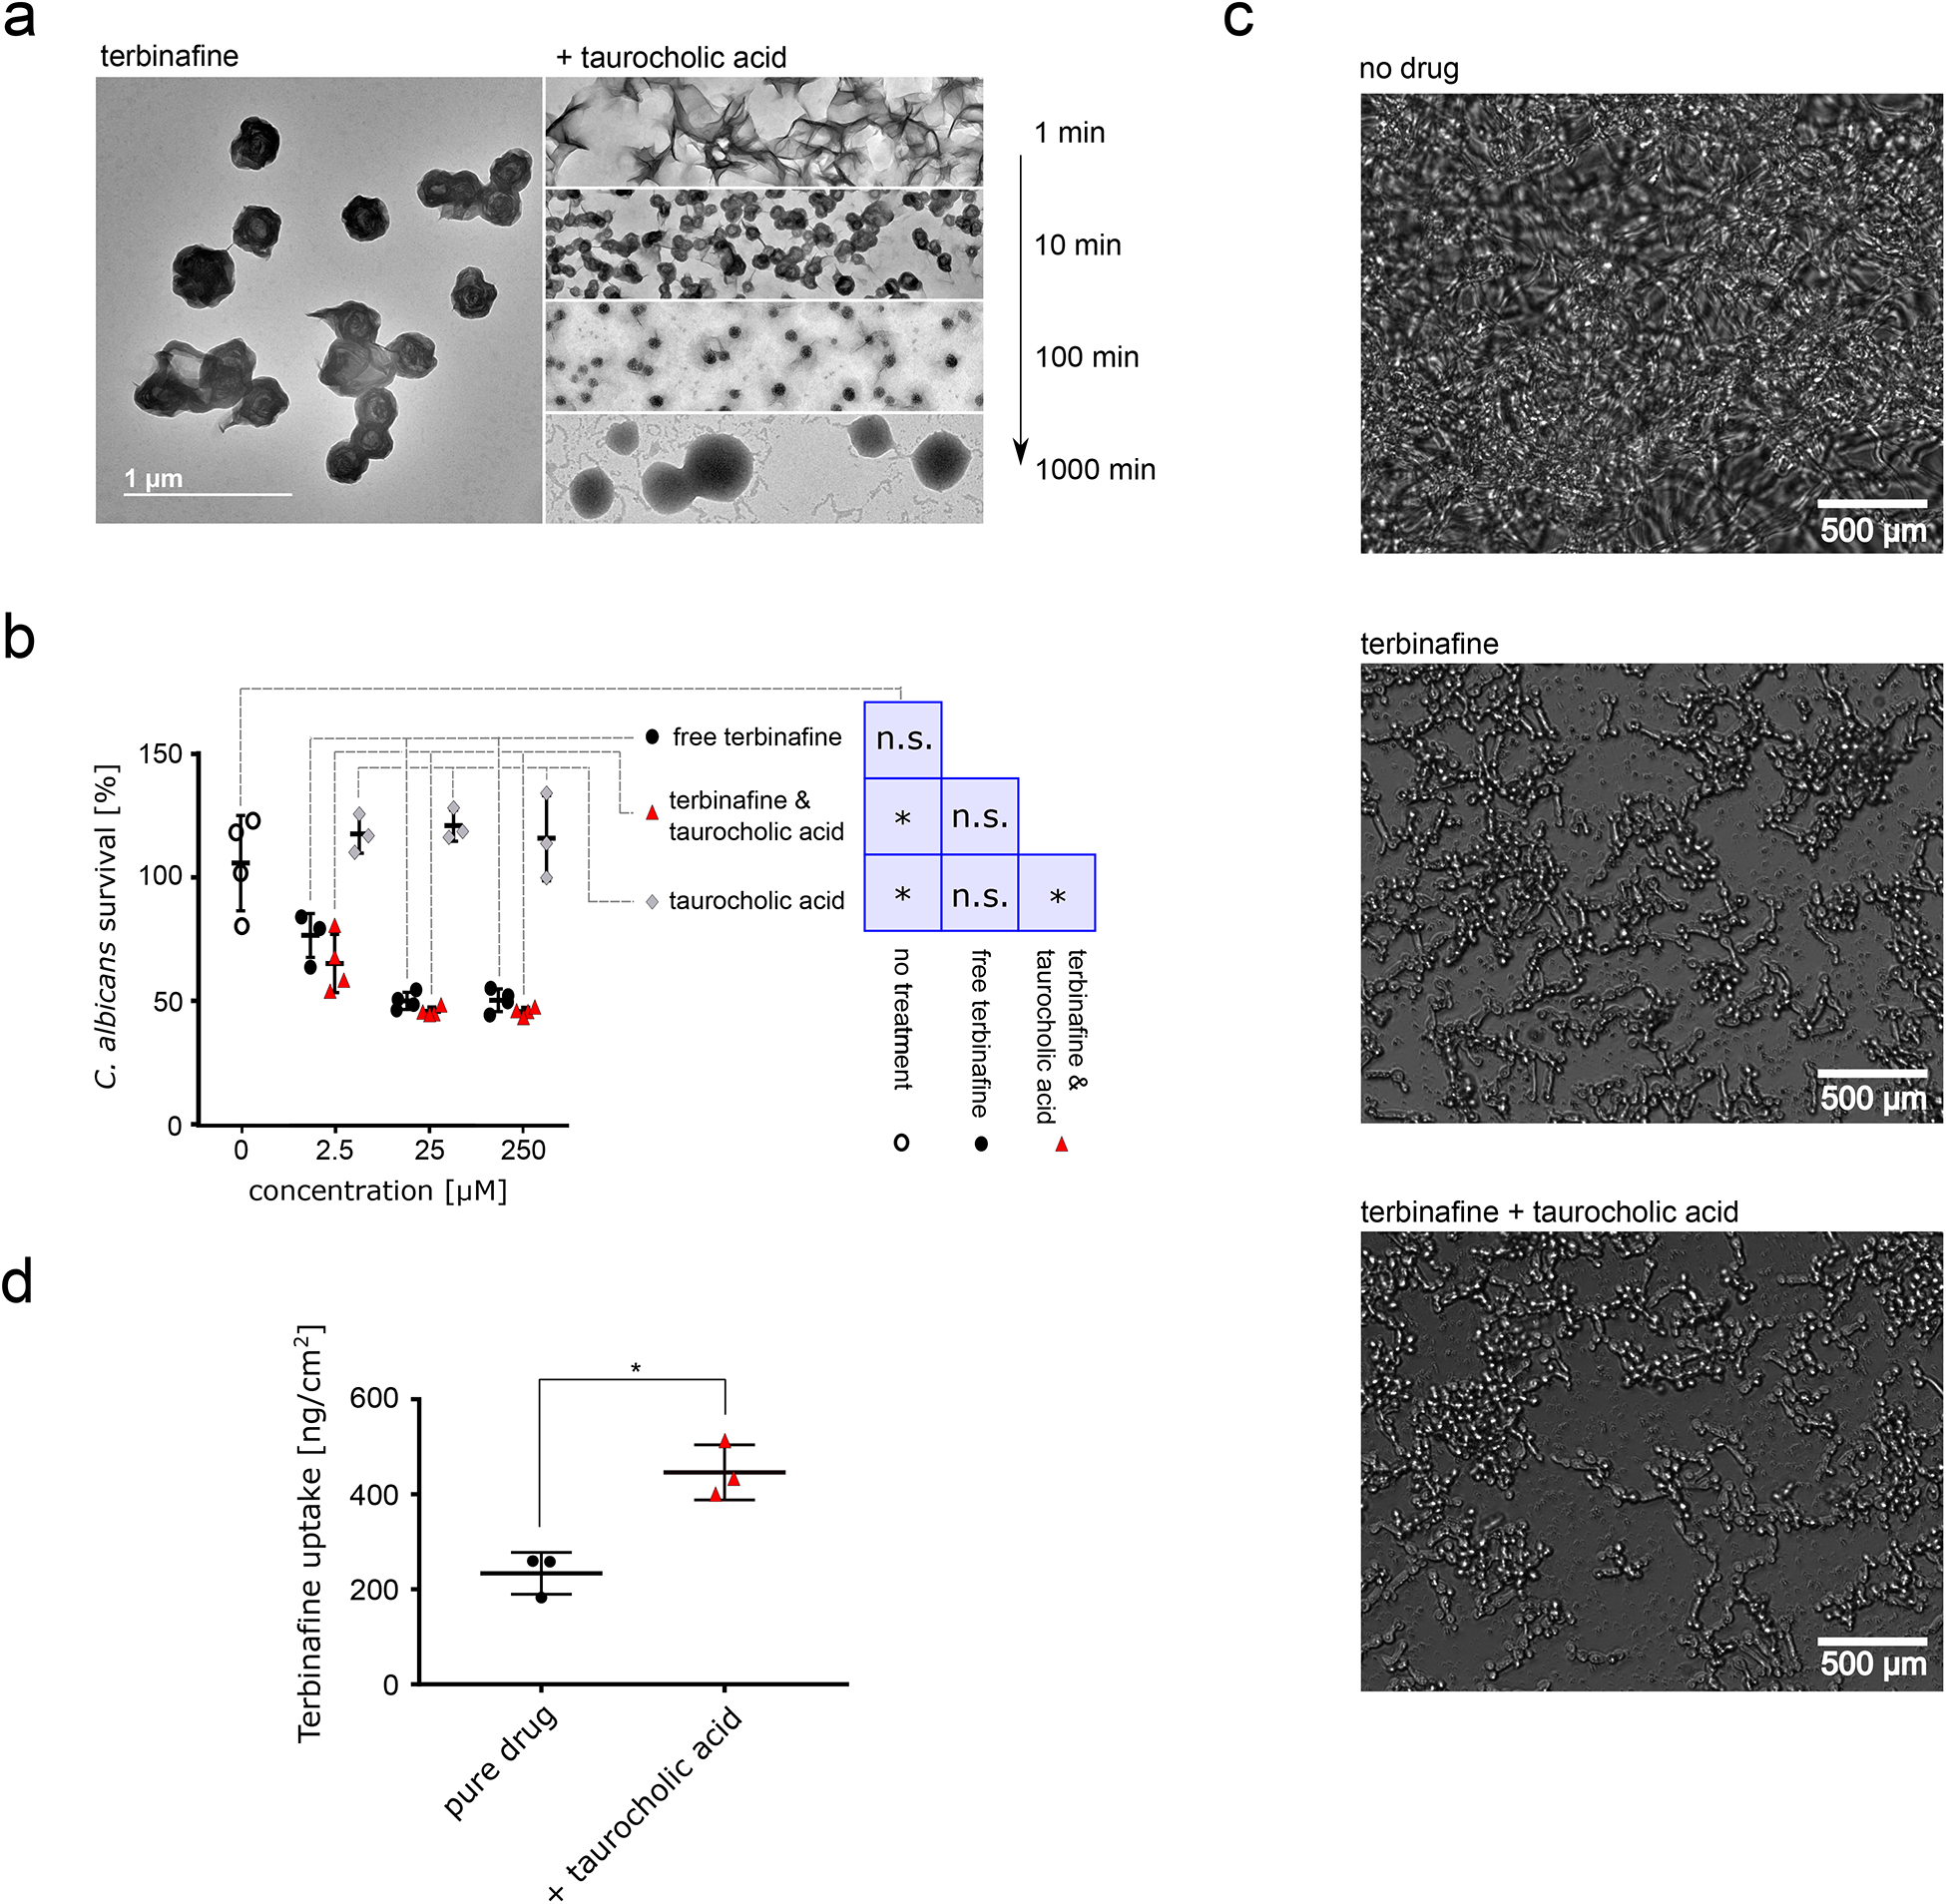
Figure 3: Characterization and ex vivo application of terbinafine & taurocholic acid particles.

a TEM images of terbinafine alone (left) and nanoparticles formulated together with taurocholic acid. TEM images taken at different timepoints after co-assembly initiation are depicted on the right. Scale bar corresponds to 1 μm, scale consistent across images. b C. albicans survival after treatment with terbinafine alone (black), terbinafine & taurocholic acid nanoparticles (red), or pure taurocholic acid (formulation control, light grey). Concentrations indicate terbinafine and/or taurocholic acid concentration. XTT readouts were normalized according to untreated control (100% survival, 1% DMSO in PBS, hollow circles), n = 4 independent samples, lines correspond to mean values, error bars represent one standard deviation. We performed a one-way ANOVA (p = 0.017) followed by Tukey’s post hoc test and found that terbinafine alone shows no significant difference to any other condition while terbinafine-taurocholic acid significantly reduced C. albicans viability compared to the control treatments. c Microscopy images of C. albicans after 17h of nanoparticle treatment or terbinafine treatment compared to untreated control. d Skin uptake of terbinafine into porcine flank skin in Franz Diffusion cell measurements, n = 3 independent samples, p = 0.028 two-sided T-test. Lines corresponds to mean values; error bars represent one standard deviation. For a and c, representative images are shown from ten acquisitions generated through two independent experiments, all images reproduced the here depicted behaviour.
