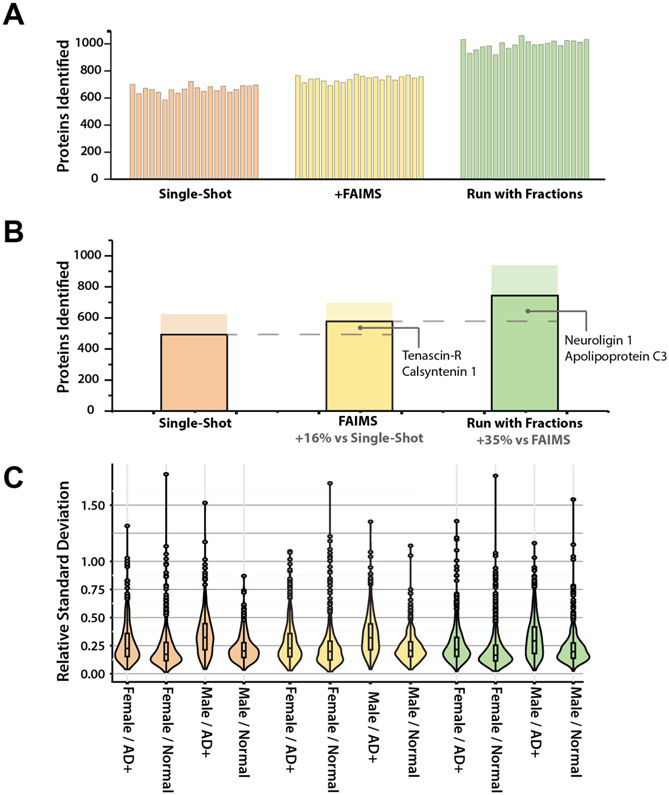
Figure 2. Distribution of proteins quantified across three methods.
(A) Number of proteins quantified in each sample for each analysis method. (B) Proteins quantified overall for each analysis method. Solid bar shows proteins quantified in all 20 samples. Translucent bar shows number of proteins quantified in at least 50% of each of the four sex-disease groups. Additional proteins quantified include several previously implicated in AD. (C) Relative standard deviation (RSD) distribution for each sex-disease group. AD groups exhibit higher median RSDs than healthy normal counterparts for all sexes and analysis strategies.

