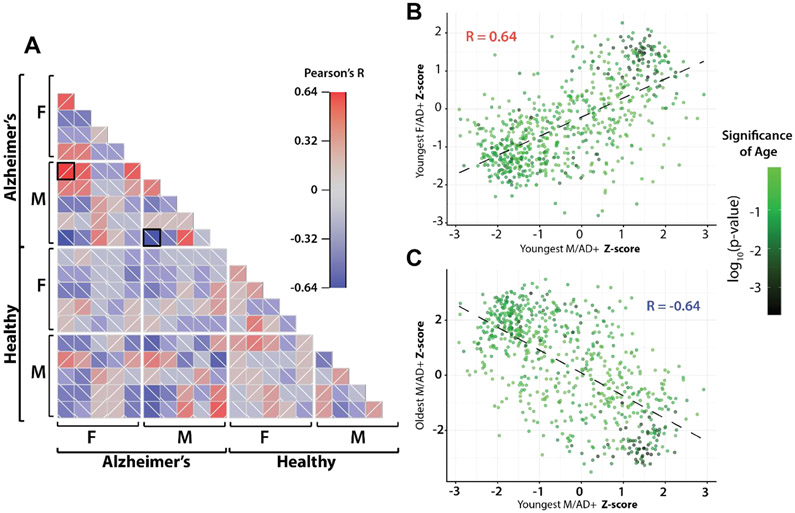
Figure 3. Pairwise Pearson correlations.
(A) Pairwise Pearson correlation across all samples. Samples are separated by sex and disease state. Within disease/sex groups, samples are ordered by age with youngest samples at left on the x-axis and at top on y-axis. Black boxes indicate comparisons expanded in B and C. (B) Scatterplot of z-score normalized protein expression between youngest male AD+ sample and youngest female AD+ sample. Points are colored by significance when including age as explanatory variable in linear model (C) Scatterplot of z-score normalized expression between youngest male AD+ sample and oldest male AD+ sample. A high number of age-related proteins are present in the quadrants driving protein correlations in both B and C.

