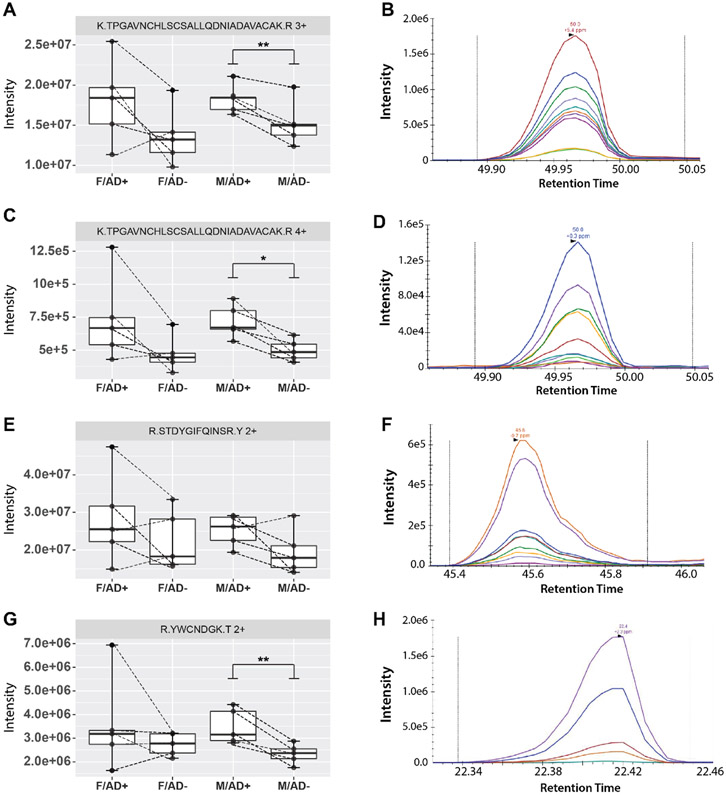
Figure 5. Intensities and example transitions for Lysozyme C peptides targeted in parallel reaction monitoring experiments.
(A, B) TPGAVNCHLSCSALLQDNIADAVACAK, 3+ charge state (C,D) TPGAVNCHLSCSALLQDNIADAVACAK, 4+ charge state (E,F) STDYGIFQINSR, 2+ charge state (G,H) YWCNDGK, 2+ charge state. Dotted lines connect sample pairs. All four peptide ions exhibited increased intensity with addition of AD across a majority of disease/normal pairs. P-values were determined by paired sample t-test. * = p-value <0.05, ** = p-value <0.01. M = male, F = female, AD+ = Alzheimer’s disease, AD− = cognitively healthy control.

