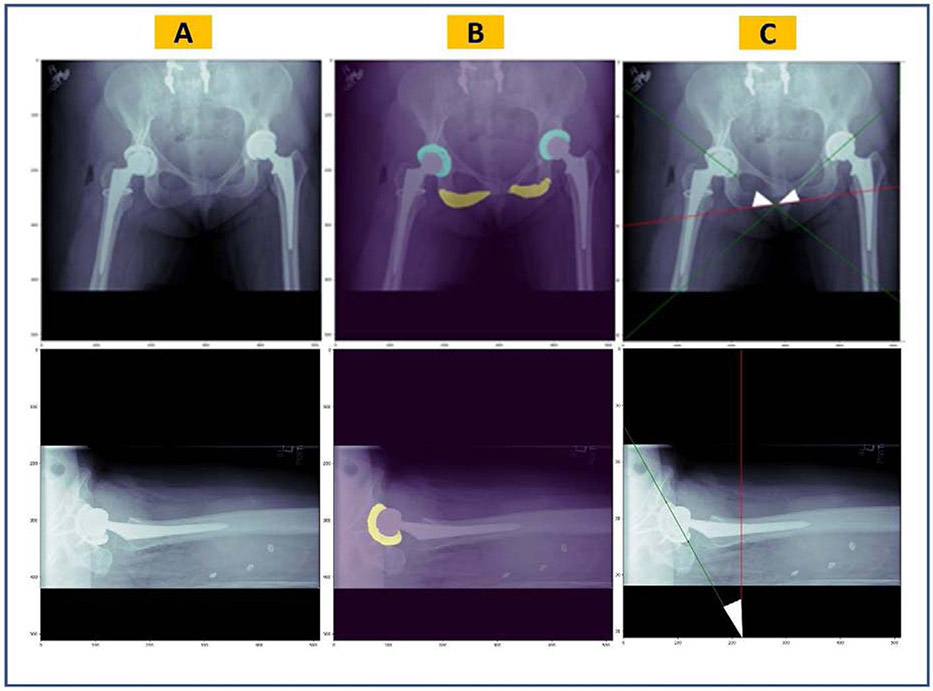
Figure 3.
Overview of the pipeline for automatic measurement of the acetabular component angles. (A) Original radiographic images, (B) predicted masks by the semantic segmentation U-Net models overlaid on the original images, (C) acetabular component longitudinal axes (in green) and the trans-ischial tuberosity line or standard vertical line (in red) which are estimated by image processing. Together, they form the inclination angle on AP pelvis images and anteversion angle on hip cross-table lateral images (white triangles).

