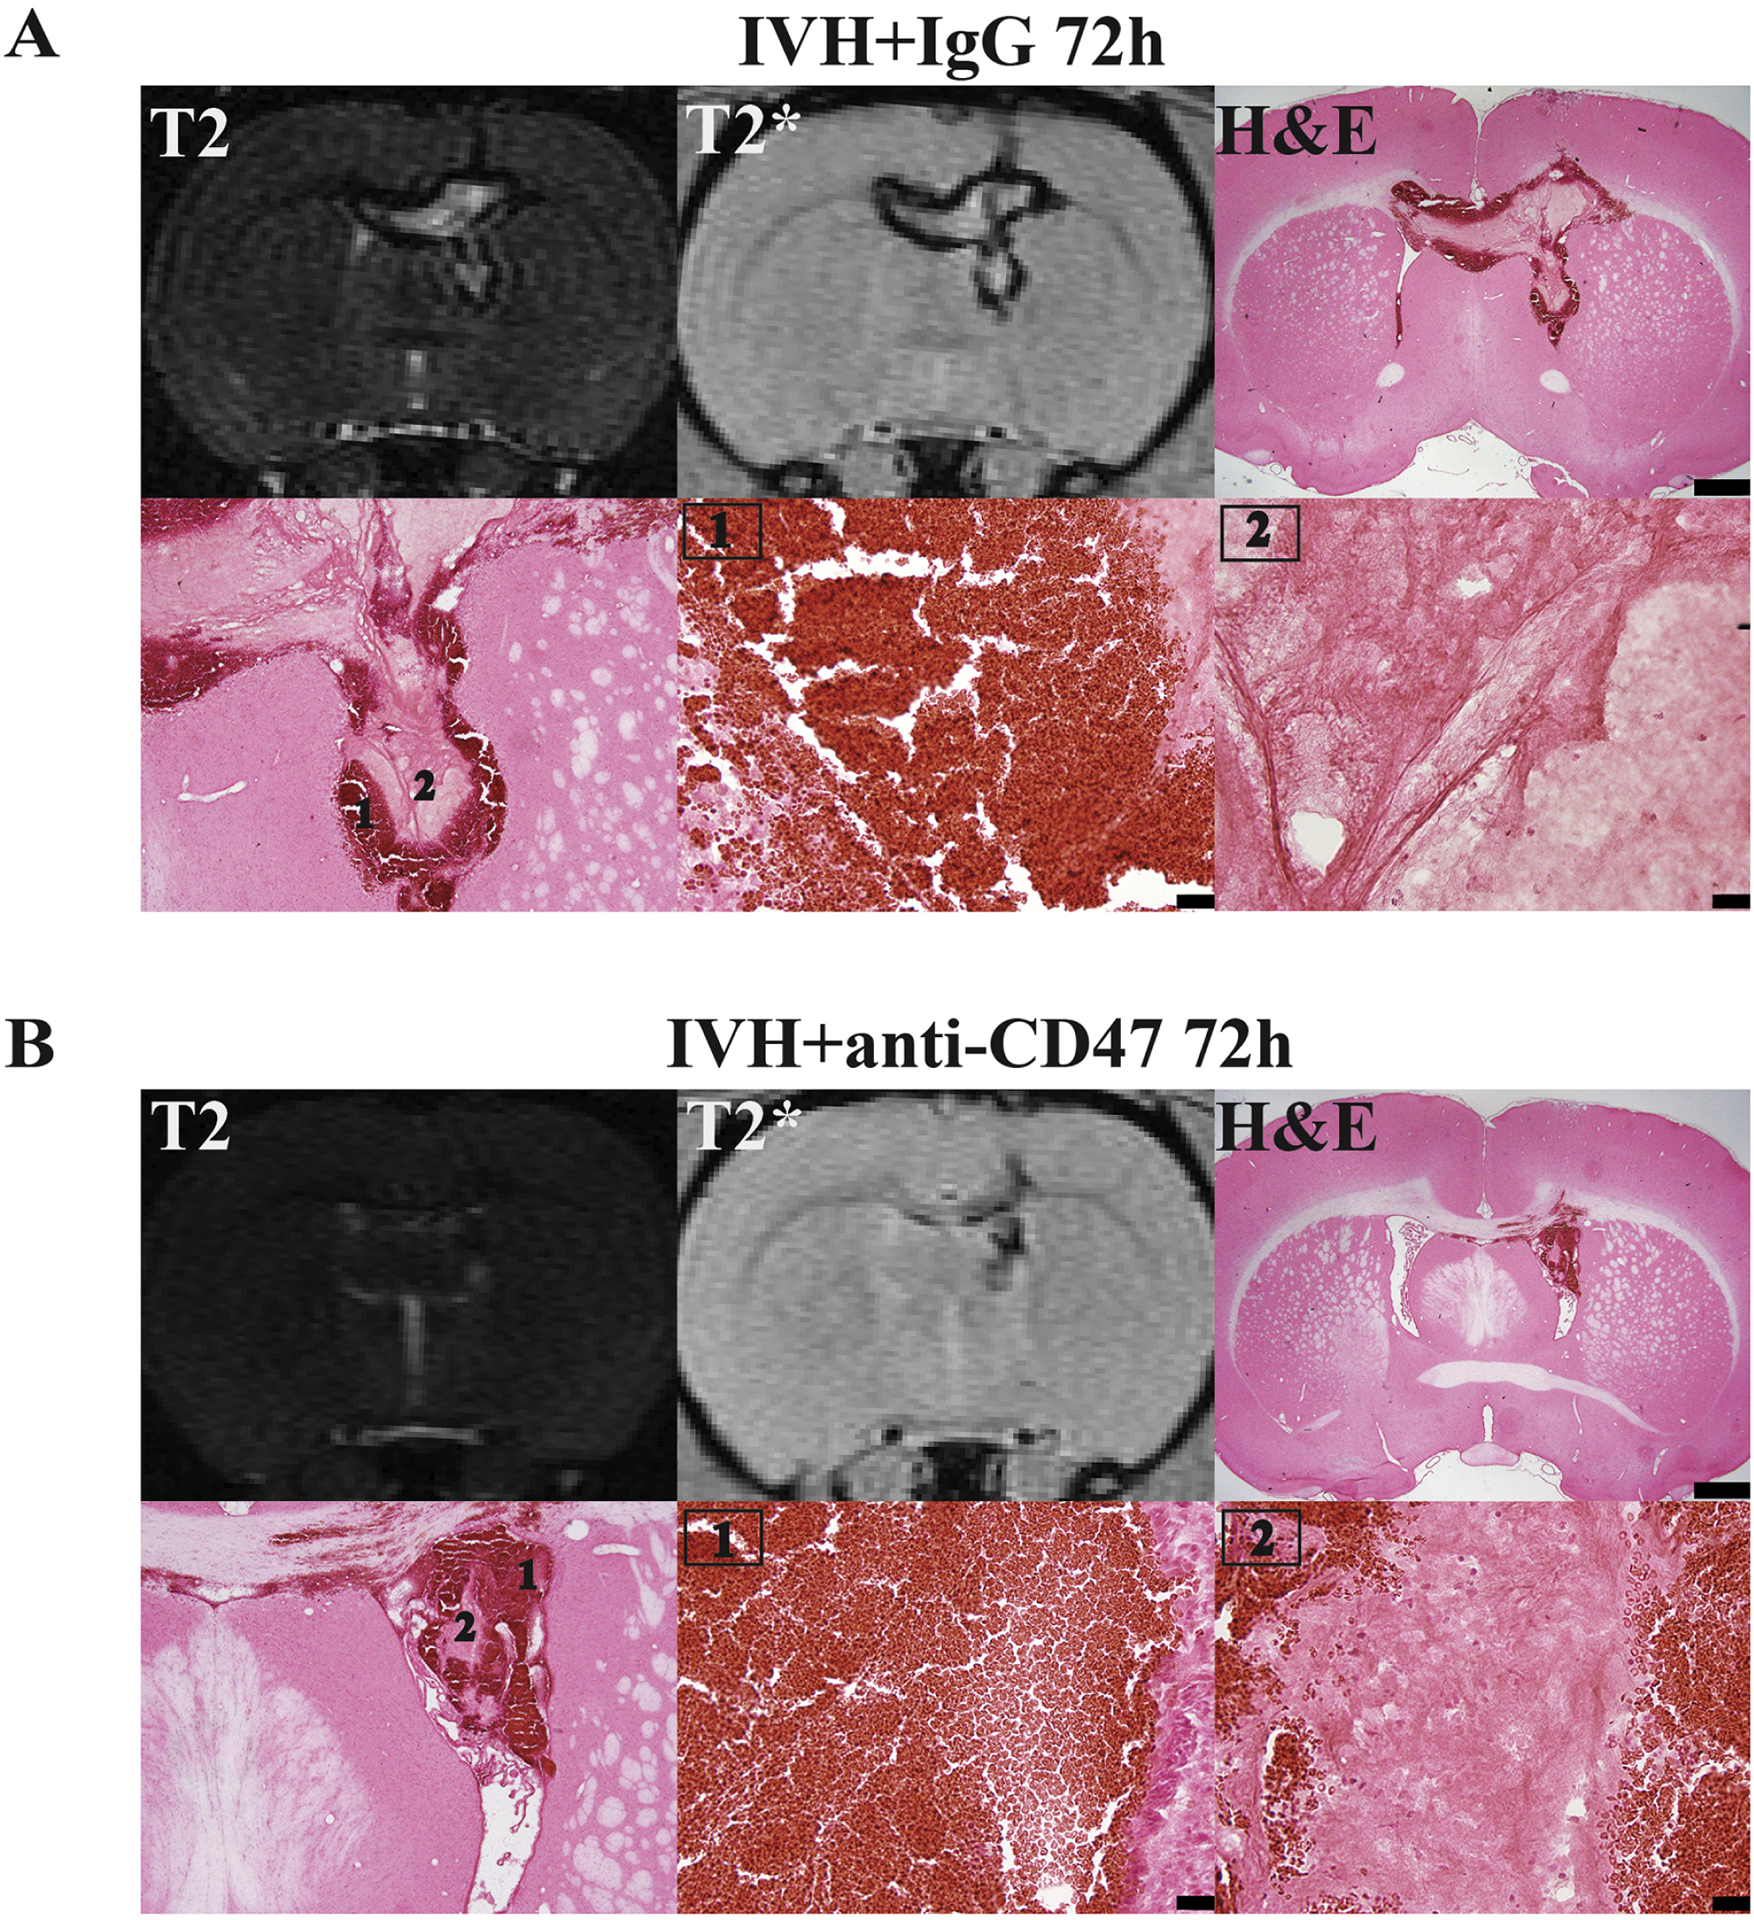
Figure 3.

Representative images of T2 and T2* MRI scans and H&E staining at the same level of the hematoma at 72 hours after intraventricular injection of 200 μl autologous blood with (A) IgG (IVH+IgG) or (B) CD47 blocking antibody (IVH+anti-CD47). Higher magnification images of the hypo-T2* (1, periphery) and the non-hypo-T2* area (2, center) of the hematoma are also shown. Scale bars are 1 mm for top panels and 20 μm for lower middle and right images.
