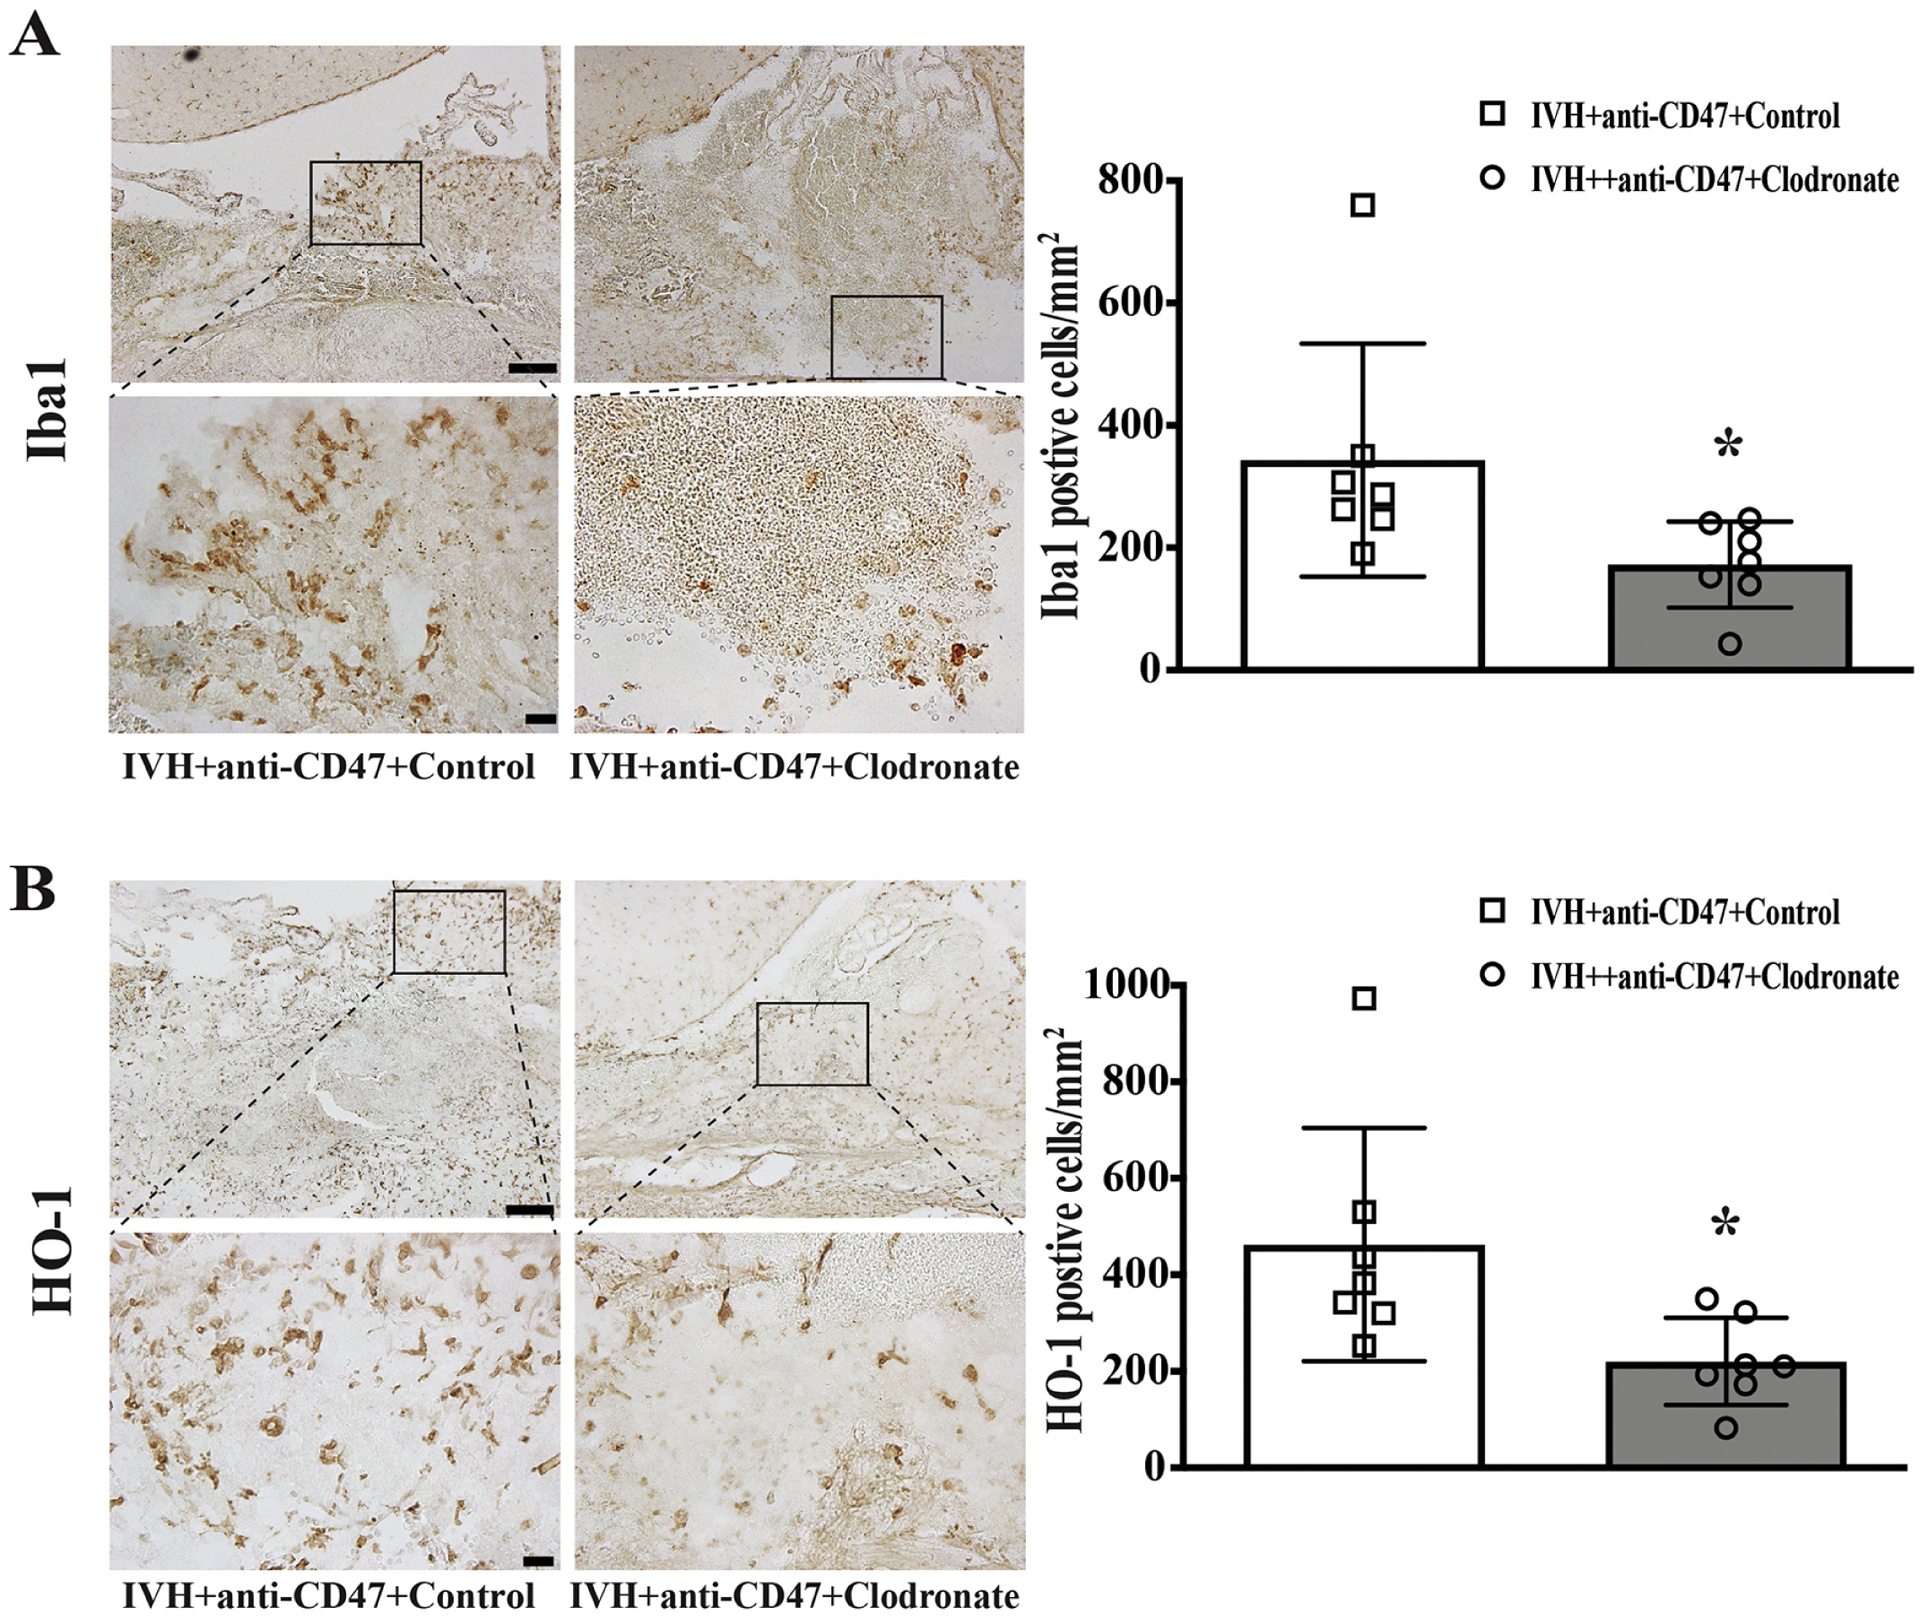
Figure 8.

(A) Iba1 immune positive cells 72 hours after intraventricular injection of 200 μl autologous blood with CD47 blocking antibody plus clodronate liposomes (IVH+anti-CD47+Clodronate) or control liposomes (IVH+anti-CD47+Control) in F344 rats. The high magnification images correspond to the hematoma. (B) HO-1 immune positive cells 72 hours after intraventricular injection of 200 μl autologous arterial blood with CD47 blocking antibody plus clodronate liposomes (IVH+anti-CD47+Clodronate) or control liposomes (IVH+anti-CD47+Control). The high magnification images correspond to the hematoma. Upper panel scale bars are 100 μm, lower panel scale bars are 20 μm. Intra-hematoma positive cells were counted and shown as mean ± SD; n= 10 per group; * p < 0.05 IVH+anti-CD47+Clodronate vs. IVH+anti-CD47+Control group.
