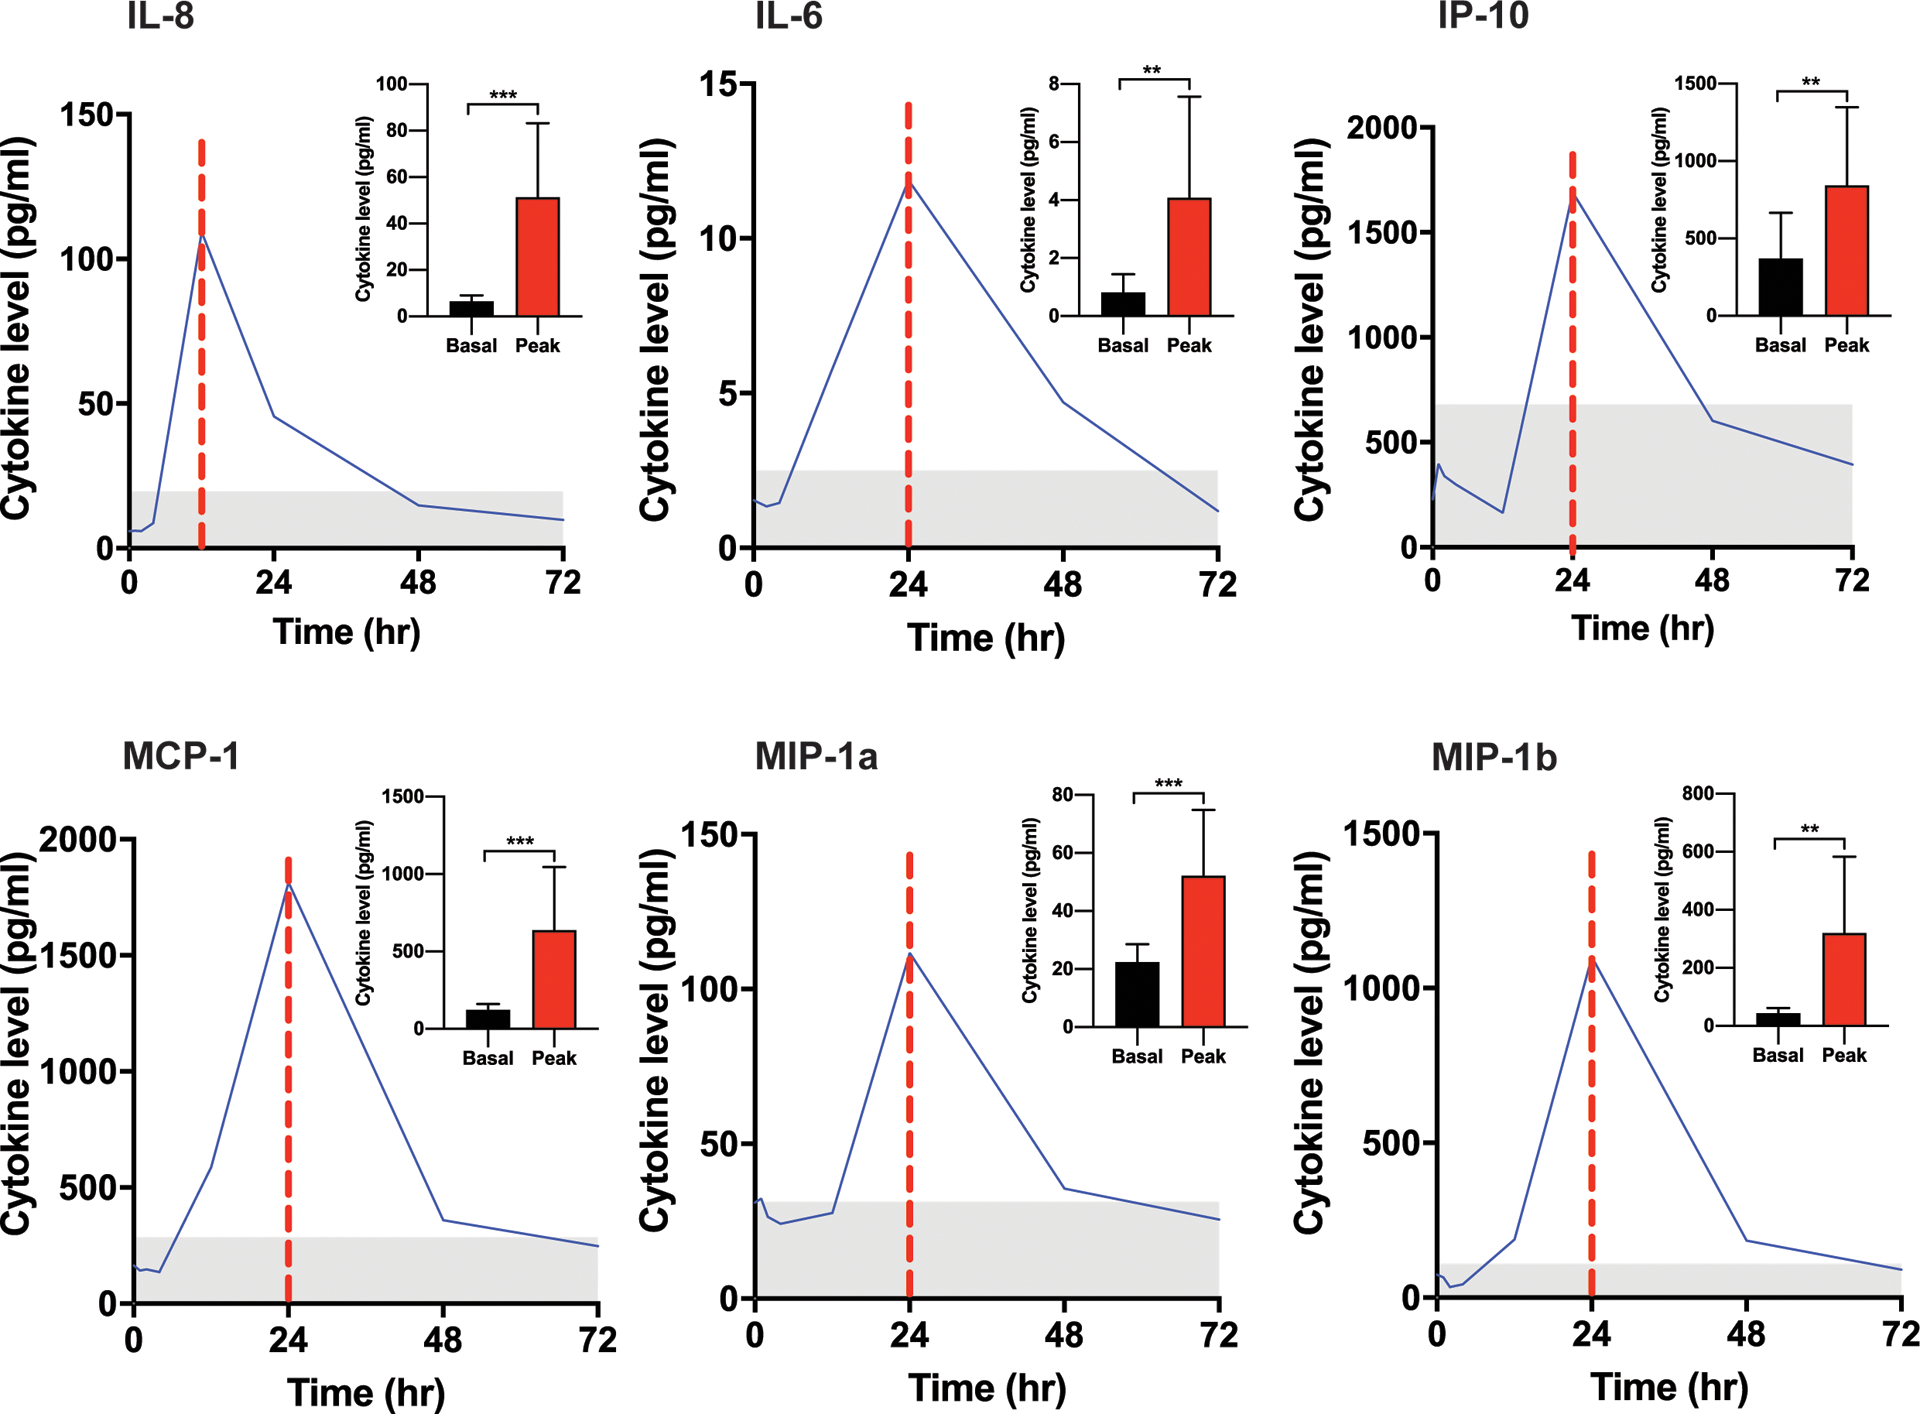
Figure 3.

Cytokine analysis in patients received an oral dose of zotiraciclib at 250mg. Cytokine level of a representative study subject versus time points from 0–72 hours after zotiraciclib dosing is plotted to demonstrate the temporal change of the cytokine release. The vertical dotted red line indicates the peak time of each cytokine release. The gray area represents the normal range defined as the mean ± 2 standard deviation that was generated from 114 healthy volunteer. The mean level of cytokines at baseline and peak time from entire cohort of patients are summarized in the insert in each plot (n=13). Cytokine level at peak time was compared with baseline level using paired t-test. n=13. * p<0.05, ** p<0.01, *** p<0.001.
