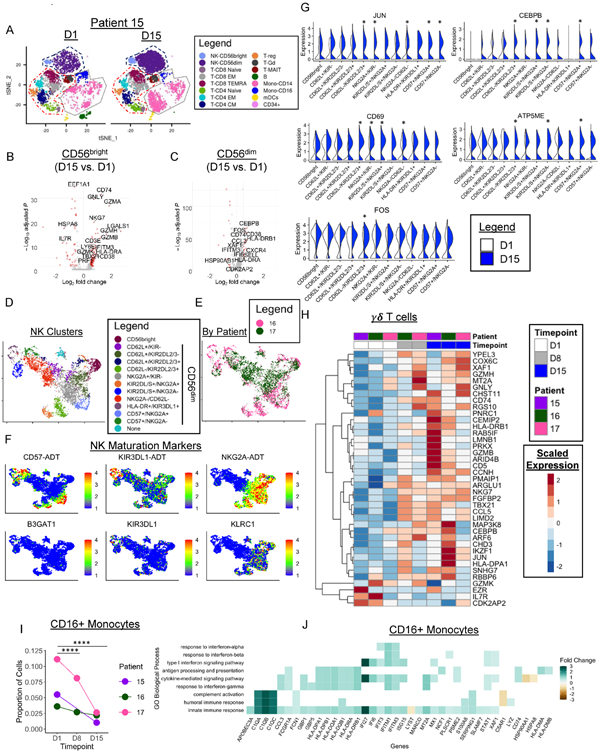
Figure 4. CITE-seq reveals activation of NK cells following N-803 plus rituximab.
A) tSNE visualization of PBMC transcriptomes colored by immune cell type in patient 027-015 (15) before (D1) and at D15 of N-803 plus rituximab. Dashed lines depict major immune cell lineages: NK (navy), T cells (red), Monocytes (grey). B-C) Volcano plots depicting summary data of the DEGs of all 3 patients in red in CD56bright and CD56dim NK cells with N-803 plus rituximab with an absolute log2 FC cut-off of ≥ 0.5. D) UMAP visualization of NK cell clusters in patients 027-016 (16) & 027-017 (17) clustered using CiteFuse with protein and RNA data. E) UMAP colored by patient. F) Feature Plots depicting protein (ADT) and RNA expression of key NK maturation markers. Min. cutoff = quantile 2 (q02), Max.cutoff = q98. G) Split violin plots depicting expression of select genes differentially expressed between D1 and D15 in each NK cell cluster. * denotes a significant change. White= Day 1, Blue = Day 15. H) Heatmap depicting select differentially expressed genes in γδ T cells between pre-treatment (D1) and Day 15. I) Line graphs depicting the proportion of CD16 Monocytes in each patient at each timepoint. Two-sided fisher’s Exact test with Holm’s multiple comparisons p-value adjustment. * = p < 0.05, ** = p ≤ 0.01, *** = p ≤ 0.001, **** = p ≤ 0.0001. J) Select enriched GO BP in CD16+ Monocytes between D15 and D1. Colored boxes depict average log2 FC of the genes in the BP gene set. White boxes correspond to genes not included in the GO BP gene set. Wilcoxon Rank-Sum test for all DEGs with an adjusted p-value of < 0.05 and fold change of ≥ 0.5 absolute log2 fold change. Enriched GO terms p < 0.05 and q-value threshold of 0.05. n=2-3 patients for all. 2 independent experiments.

