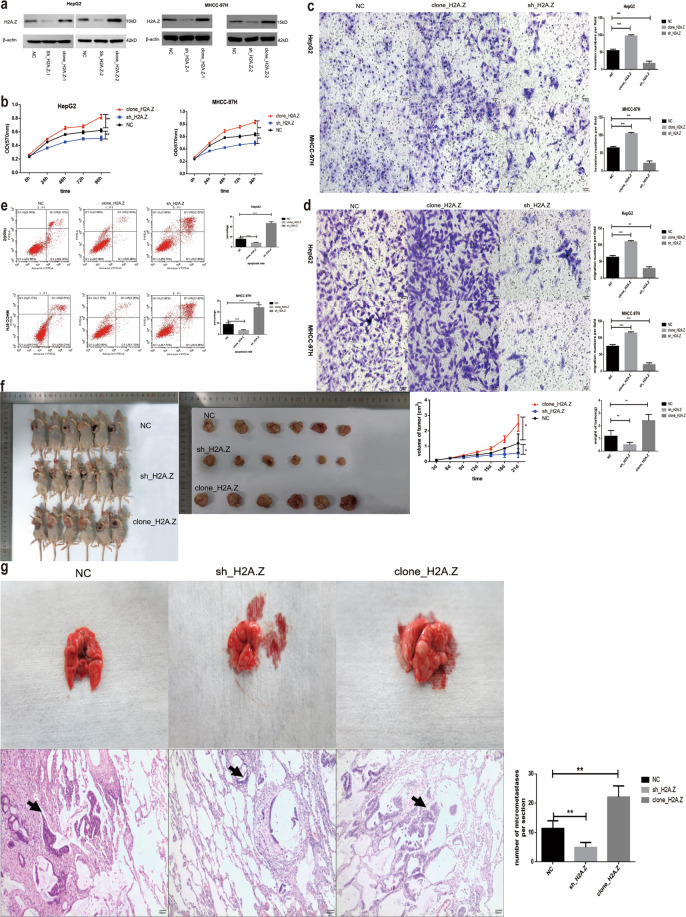
Fig. 2. Effect of H2A.Z on cell growth.
a Identification of the H2A.Z transfection effect detected by western blot. b The proliferation capability of cells was detected by MTT assays. c, d Transwell assay was adopted to test cell migration and invasion under different contexts(Scale bars: 50 μm). e Flow cytometry was utilized to test the apoptotic cells. f A subcutaneous tumor model in nude mice was used to test the tumor-forming ability of cell lines with different treatments. g A mouse lung metastasis model was used to detect cell metastasis under different contexts (The black arrow marks the metastases) (Scale bars: 100 μm). The data are expressed in terms of mean ± SD (Student’s t-test used in Fig b–g; *P < 0.05; **P < 0.01; ***P < 0.001. ****P < 0.0001; n = 3 in each group).

