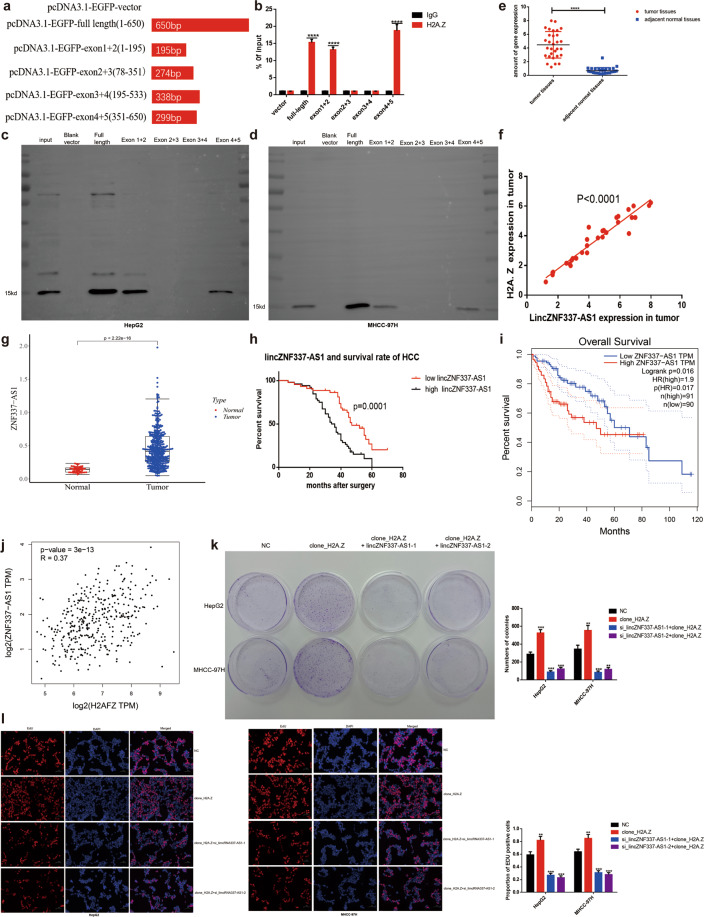
Fig. 6. Identification of lincZNF337-AS1 binding sites to H2A.Z, identification of lincZNF337-AS1 expression levels in HCC, and relationship with prognosis of HCC patients.
a Schematic diagram of lincZNF337-AS1 full-length and truncated fragments. b The interaction of lincZNF337-AS1 truncated fragments with H2A.Z in HEK293T cells was verified by a RIP-qPCR assay. c, d RNA-pulldown assay verifies the binding site of lincZNF337-AS1 to H2A.Z in HCC cells. e Scatter plots comparing lincZNF337-AS1 expression in HCC samples and normal liver tissue samples detected by qPCR (Student’s t-test used in Fig e, n = 30 in each group). f The positive correlation between lincZNF337-AS1 and H2A.Z expression was analyzed on the basis of data of 30 HCC samples. g LincZNF337-AS1 transcript between HCC tissues and normal paracancer tissues was analyzed in the publicly accessible samples(TCGA http://gepia.cancer-pku.cn/, T = 375; N = 50, Software: beeswarm, R package). h Kaplan–Meier survival curves illustrating the overall survival and disease-free survival of patients with HCC associated with lincZNF337-AS1 expression in 96 cases. i The negative correlation between lincZNF337-AS1 expression and overall survival was analyzed on the basis of TCGA data in patients with HCC(Software: survival, R package). j The positive correlation between lincZNF337-AS1 and H2A.Z expression was analyzed on the basis of TCGA data in patients with HCC(Software: ggplot2, R package). k, l The proliferation capability of cells was detected by colony formation assay and EdU assay (scale bar = 50 μm). The data are expressed in terms of mean ± SD (Student’s t-test used in b, k, and l; Kaplan-Meier test used in g; Linear regression test used in j; ****P < 0.0001; n = 3 in each group).

