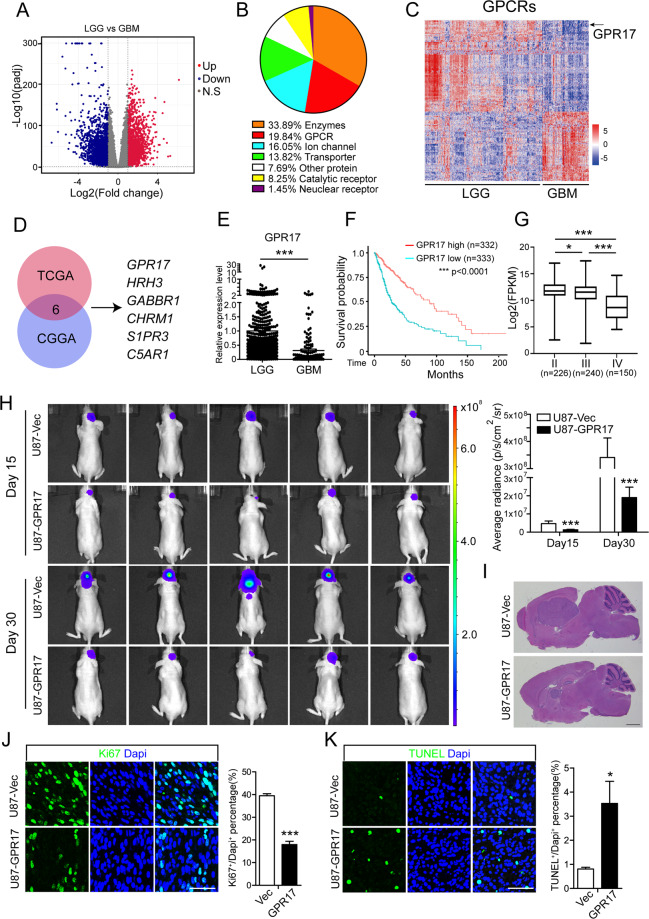
Fig. 1. GPR17 suppressed glioma tumorigenesis.
A Volcano plot of the differentially expressed protein-coding genes between LGG (n = 511) and GBM (n = 156) from the TCGA cohort. B Pie chart showing the proportions of the drug targets in differentially expressed genes. C Heatmap analysis of the differentially expressed GPCRs between LGG and GBM patients from TCGA dataset. Gene expression values were z-transformed and were colored red for high expression and blue for low expression. Black arrow indicated GPR17. D Venn diagram showing the differentially expressed GPCRs found in both TCGA and CGGA database after screening. E mRNA levels of GPR17 in LGG (n = 511) and GBM (n = 156) patients from the TCGA cohort. F Kaplan–Meier analysis of patients overall survival data based on high versus low expression of GPR17 in glioma, grades II–IV, from the TCGA dataset. P values were obtained from the log-rank test. ***p < 0.001, G Expression of GPR17 in grade II (n = 226), grade III (n = 240), and GBM (n = 150) patients from the TCGA cohort. H BALB/c nude mice (n = 5 per group) were xenotransplanted with U87-Vec or GPR17-overexpressing U87MG cells through stereotatic injection. Bioluminescence imaging was performed on days 15 and 30 after xenotransplantation. Data represent the means ± SEM from five mice. ***P < 0.001, Student’s t-test. I H&E staining of brain sections with U87-Vec and U87-GPR17 tumors. Scale bar, 300 μm. J, K Immunofluorescent staining against Ki67 (J) and TUNEL (K) of the tumor sections. Scale bar, 50 μm.

