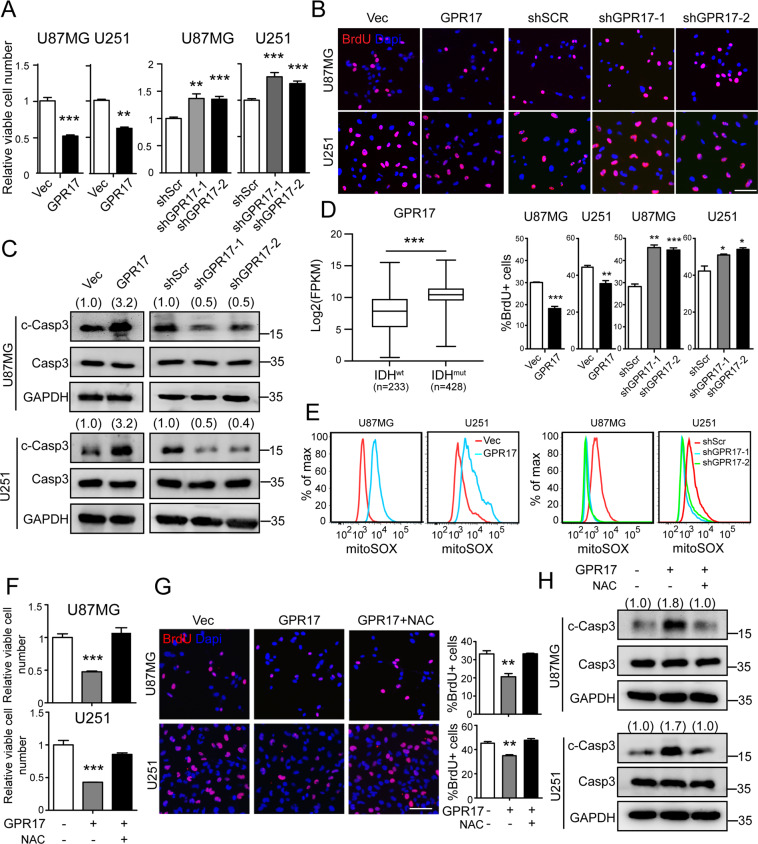
Fig. 2. GPR17 inhibited cell proliferation and induced cell death by inducing ROS level.
GPR17-overexpressing/knockdown U87MG or U251 stable cell lines (U87/U251-GPR17 or U87/U251-shGPR17) were generated as described in “Materials and methods”. After confirming the overexpression or knockdown efficiencies of GPR17, cells were cultured and harvested for the subsequent experiments. A CCK-8 assay was performed to examine viable cell numbers. B Immunofluorescent staining against BrdU was performed to examine the numbers of proliferating cells, scale bar, 400 μm. The proportions of the BrdU+ cell in the total cell number were displayed in the lower panel. C Western blot was performed to examine intracellular cleaved-caspase3 levels. Densitometric quantification of cleaved-caspase3/caspase3 ratio from at least three independent assays was indicated on top of each band, respectively. D Expression of GPR17 in IDHwt (n = 233) and IDHmut (n = 428) glioma patients from the TCGA cohort. E Flow cytometry analysis was performed to assess mitochondrial ROS level. F–H Control and U87/U251-GPR17 cells were treated with vehicle or N-acetyl-l-cysteine (5 mM) for 48 h, CCK-8 assays (F), immunofluorescent staining against BrdU (G), and western blotting against cleaved-caspase3 (H) were performed as mentioned above. Scale bar, 400 μm. Densitometric quantification of cleaved-caspase3/caspase3 ratio from at least three independent assays was indicated on top of each band, respectively. For all panels, data represent the means ± SEM from three independent experiments. *p < 0.05, **p < 0.01, ***p < 0.001, Student’s t-test.

