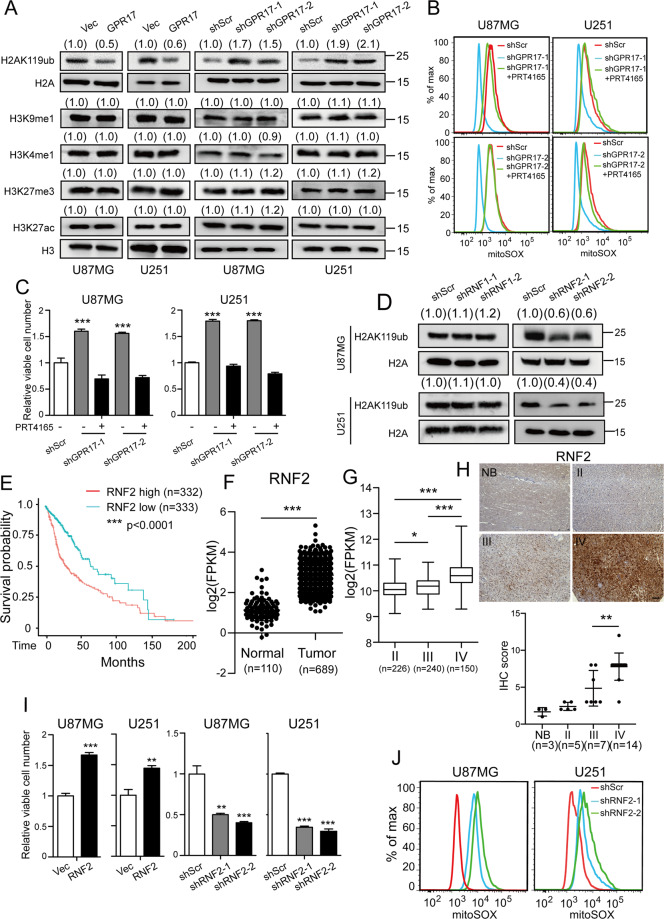
Fig. 3. GPR17 inhibited RNF2-mediated histone monoubiquitination.
U87/U251-GPR17 or U87/U251-shGPR17 cells were prepared as described in Fig. 2. A Western blot was performed to detect the indicated protein levels. Densitometric quantification of H2AK119ub/H2A, H3K9me1/H3, H3K4me1/H3, H3K27me3/H3, or H3K27ac/H3 ratio from at least three independent assays was indicated on top of each band, respectively. B, C Control and U87/U251-shGPR17 cells were treated with/without 10 μM PRT4165 for 48 h. Flow cytometry analysis was performed to assess mitochondrial ROS level (b), and CCK-8 assay was performed to examine viable cell numbers (C). D Control (Scramble), RNF1, or RNF2 shRNAs were transfected to U87MG or U251 cells to knockdown their expressions. Cells were then subjected to western blot assays to test the H2AK119ub level. Densitometric quantification of H2AK119ub/H2A ratio from at least three independent assays was indicated on top of each band, respectively. E Kaplan–Meier analysis of patients overall survival data based on high versus low expression of RNF2 in gliomas, grades II–IV, from the TCGA dataset. F Expression of RNF2 in normal (n = 110) and tumor (n = 689) from the TCGA cohort. ***p < 0.001, Student’s t-test. G Expression of RNF2 in grade II (n = 226), grade III (n = 240), and GBM (n = 150) patients from the TCGA cohort. H RNF2 expression in normal brain (NB) tissues or glioma was examined by IHC staining (NB, n = 3; Grade II, n = 5; Grade III, n = 7, Grade IV, n = 14), scale bar 250 μm. **p < 0.01, Student’s t-test. I, J RNF2 overexpressing/knockdown U87MG or U251 stable cell lines (U87/U251-RNF2 or U87/U251-shRNF2) were generated as described in “Materials and methods”. After confirming the overexpression or knockdown efficiencies of RNF2, cells were cultured and harvested for CCK-8 assays to examine viable cell numbers (I), or flow cytometry analysis to assess mitochondrial ROS level (J).

