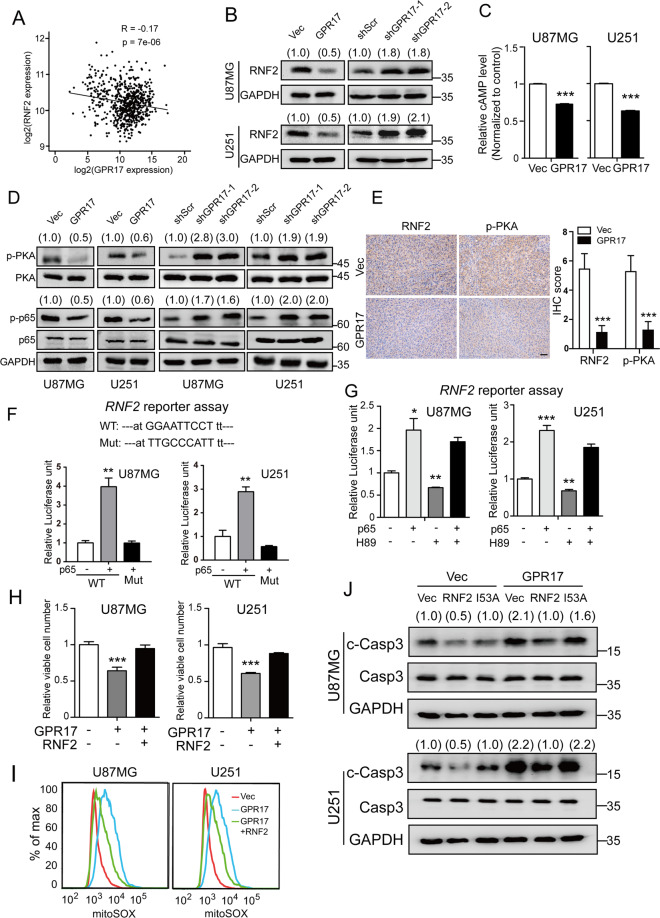
Fig. 4. GPR17 suppressed the expression of RNF2 through cAMP/PKA/p65 axis.
A Correlation plot of the mRNA levels of GPR17 and RNF2 in glioma from 667 patient samples in TCGA dataset. B Control, U87/U251-GPR17, or U87/U251-shGPR17 cells were subjected to western blot to assess the protein level of RNF2. C cAMP levels were measured in control and U87/U251-GPR17 cells. D Control, U87/U251-GPR17, or U87/U251-shGPR17 cells were subjected to western blot to detect the indicated protein levels. Densitometric quantification of p-PKA/PKA, or p-p65/p65 ratio from at least three independent assays was indicated on top of each band, respectively. E The protein levels of RNF2 or p-PKA of brain sections with U87-Vec and U87-GPR17 tumors were evaluated by IHC analysis. Scale bar 50 μm. F, G U87MG or U251 cells were co-transfected with wild type (WT) or mutant RNF2 promoter (2.0 kb)-firefly luciferase, Renilla luciferase, and p65-overexpressing vectors for 24 h (F); or co-transfected with WT RNF2 promoter (2.0 kb)-firefly luciferase, Renilla luciferase and p65-overexpressing vectors for 24 h, and then treated with or without 10 μM H89 treatment for 48 h (G). Cells were then harvested for dual-luciferase reporter assay following the manufacturer’s instructions. H, I Control or U87/U251-GPR17 cells were transfected with control or RNF2-overexpressing vectors for 48 h, and then CCK-8 assays were performed to measure viable cell numbers (H), flow cytometry analyses were performed to assess mitochondrial ROS levels (I). J Control or U87/U251-GPR17 cells were transfected with RNF2 wild type/I53A mutant-overexpressing vectors for 48 h. Cells were then harvested for western blot against cleaved-caspase3. Densitometric quantification of cleaved-caspase3/caspase3 ratio from at least three independent assays was indicated on top of each band, respectively. For all panels, data represent the means ± SEM from three independent experiments. *p < 0.05, **p < 0.01, ***p < 0.001, Student’s t-test.

