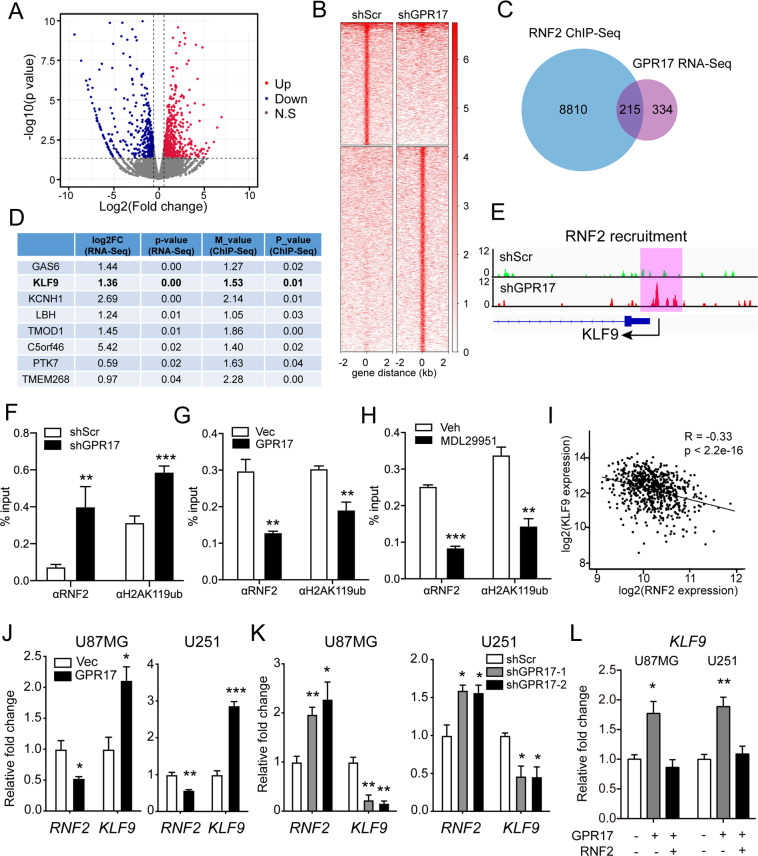
Fig. 5. KLF9 was a downstream target for GPR17 and RNF2 in glioma cells.
A Control and U87-GPR17 cells were subjected to RNA-Seq analysis. Volcano plot depicted gene expression changes between control and U87-GPR17 cells. B Control and U87-shGPR17 cells were subjected to RNF2 ChIP-Seq analysis. Density heatmap showed the RNF2 recruitment within ±2 kb around the RNF2 peak center. C Venn diagram showing the overlapped genes in ChIP-Seq and RNA-Seq analyses. D Gene list ranked by RNA-Seq p value with RNF2 binding on promoter-TSS region. E Diagram showing RNF2 enrichment on KLF9 promoter-TSS region. F–H U87-shScr/shGPR17 (f), U87-Vec/GPR17 (G), or U87MG cells treated with Vehicle/MDL29951 (300 μM) for 48 h (H) were subjected to RNF2 and H2AK119ub ChIP assay; real-time PCR analysis was then performed to assess the relative enrichment of RNF2 and H2AK119ub in promoter-TSS region of KLF9. I Correlation plot of RNF2 and KLF9 mRNA expression in glioma, grades II–IV, from the TCGA dataset (n = 667). J, K Control, U87/U251-GPR17, or U87/U251-shGPR17 cells were prepared as in Fig. 2. Cells were harvested for real-time PCR analysis to assess the mRNA levels of RNF2 and KLF9. L Control or U87/U251-GPR17 cells were transfected with control or RNF2-overexpressing vectors for 48 h, and then subjected to real-time PCR analysis to assess the mRNA levels of KLF9. For all panels, data represent the means ± SEM from three independent experiments. *p < 0.05, **p < 0.01, ***p < 0.001, Student’s t-test.

