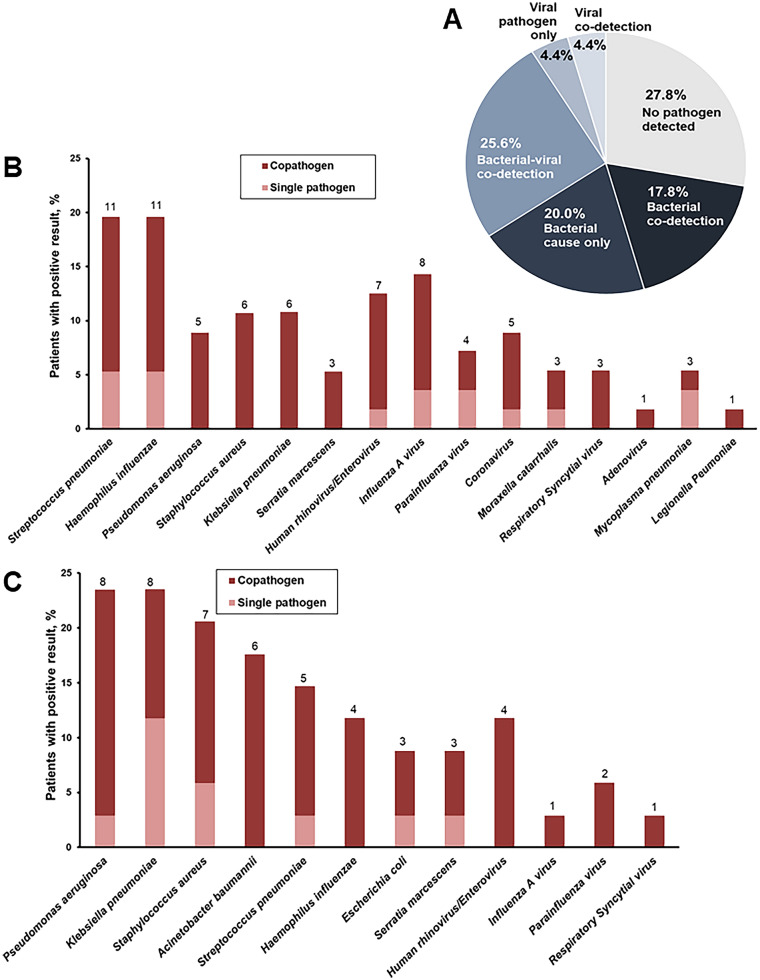
Fig. 2.
Pathogen detection among hospitalized patients with sepsis and severe lower respiratory tract infections. a Proportions of viral, viral–viral, bacterial–viral, bacterial, and no pathogen detected are provided in the pie chart for the total study cohort. Numbers and percentages of patients with community-acquired pneumonia b without and c with risk factors for multidrug-resistant pathogens, in whom a specific pathogen (single pathogen is indicated in light pink color; co-pathogens are indicated in deeper color) was detected are provided in the bar chart. Pathogens detected in a single patient are represented in their respective bars

