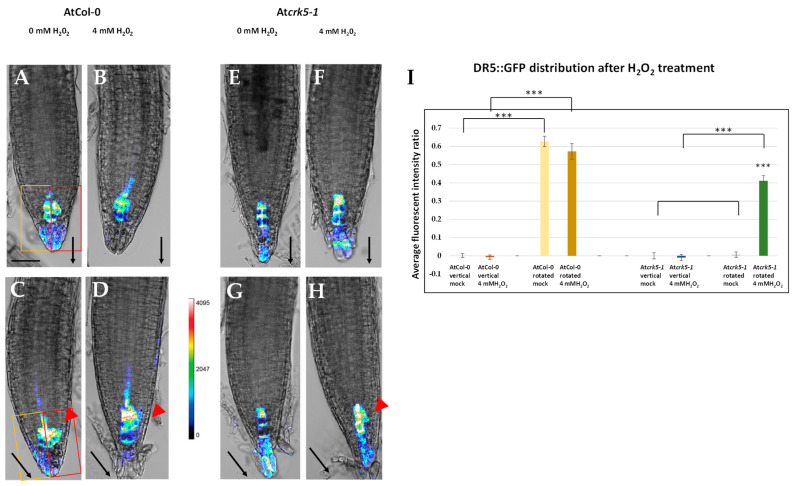
Figure 5.
H2O2 treatment restores the distribution of the DR5::GFP signal in gravistimulated Atcrk5-1 root meristems. Distribution of the DR5::GFP signal in the 6-day-old AtCol-0 wild type (A–D) and mutant Atcrk5-1 (E–H) seedling roots without (A,C,E,G) or treated with 4 mM H2O2 (B,D,F,H). Vertically-grown (A,B,E,F) and gravistimulated (−135° rotation for 4–5 h; C,D,G,H) roots were compared. (I) Quantification of the DR5::GFP fluorescence intensity ratio by investigating the average pixel intensities measured in equally sized areas at both sides of the GFP signals by ImageJ/Fiji. At least 5–10 images from the wild type and mutant categories were analysed in each version from three independent experiments. Values near zero represent a symmetrical DR5::GFP signal position, while values higher than 0 mean an asymmetrical DR5::GFP signal position. Asterisks indicate significant differences between the corresponding mock control and the treatment (two-way ANOVA, means comparisons was carried out by Bonferroni; *** p < 0.001). The fluorescence intensity was translated into a colour code (scale is in the middle). Black arrows show the direction of the gravity vector. Red arrowheads indicate the lateral redistribution of auxin towards the gravity vector. Rectangles on (A,C) images represent the equally sized areas. Scale bars = 50 µm. The original DR5::GFP fluorescent images (without heatmap) are shown as Supplemental Figure S2.

