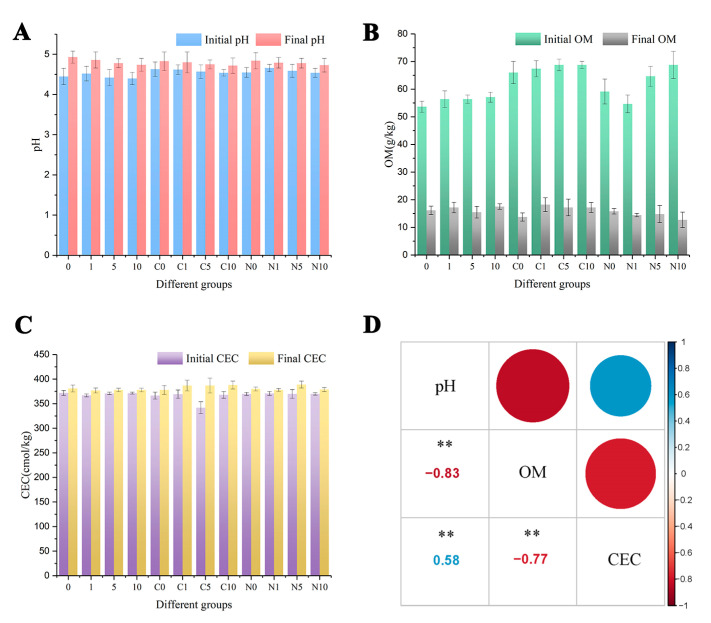
Figure 6.
(A) The changes in soil pH before and after incubation. (B) The changes of OM in the soil. (C) The changes of CEC under different treatments before and after incubation. All values represent the mean ± SE, n = 3. The one-way ANOVA indicates the significant differences at p < 0.05 according to Tukey test. (D) The correlation among pH, OM and CEC. “**” means that the correlation at the 0.01 level is significant.

