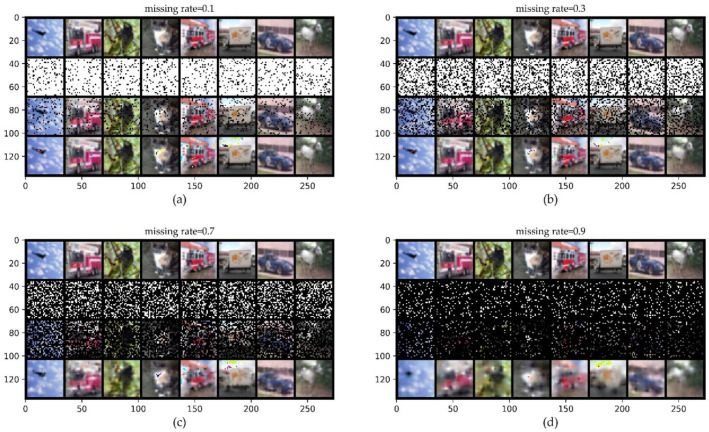
Figure 8.
ConvCNPs-Net for CIFAR10 with MR. (a–d) show that the missing rate takes values from [0.1, 0.3, 0.7, 0.9], respectively, to test the performance of the trained ConvCNPs-Net and ConvCNP–SDE models. For each panel, the top row shows the original ID data of CIFAR10, the second row demonstrates the mask based on MR, the third row exhibits the CIFAR10 data with the mask, and the bottom row displays how the masked CIFAR10 data are completed by the ConvCNPs of the ConvCNP–SDE model.

