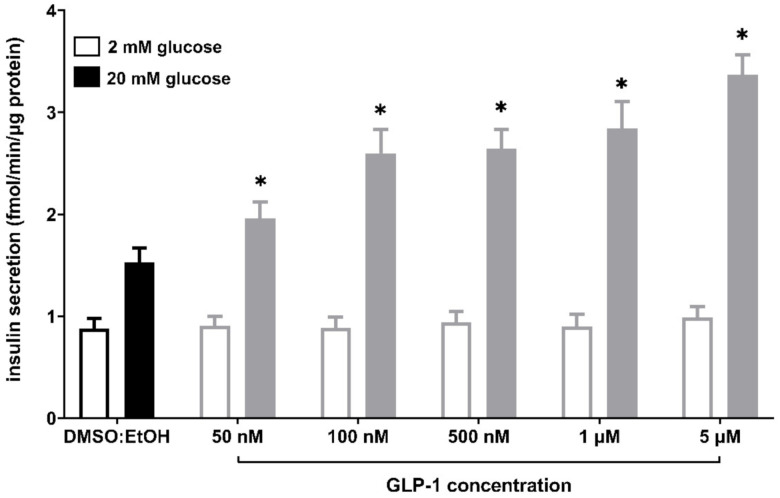
Figure 6.
GSIS in MIN6 cells stimulated with GLP-1 in 50 nM, 100 nM, 500 nM, 1 μM, and 5 μM concentrations versus compound solvent control (DMSO:EtOH). Results are presented as means ± SEM from 3-4 independent experiments, 4-5 biological replicates each. Secreted insulin was quantified at 2 mM glucose (open bars) and 20 mM glucose conditions (closed bars). p < 0.05 for secretion was significantly different from 20 mM glucose control (*). No statistically significant difference was observed between control conditions and GLP-1-stimulated samples at 2 mM glucose.

